Power/temperature – Chatsworth Products CPI Power Management Tool User Manual
Page 38
Power Management Tool Manual
March 2014
Chatsworth Products, Inc.
(CPI)
38
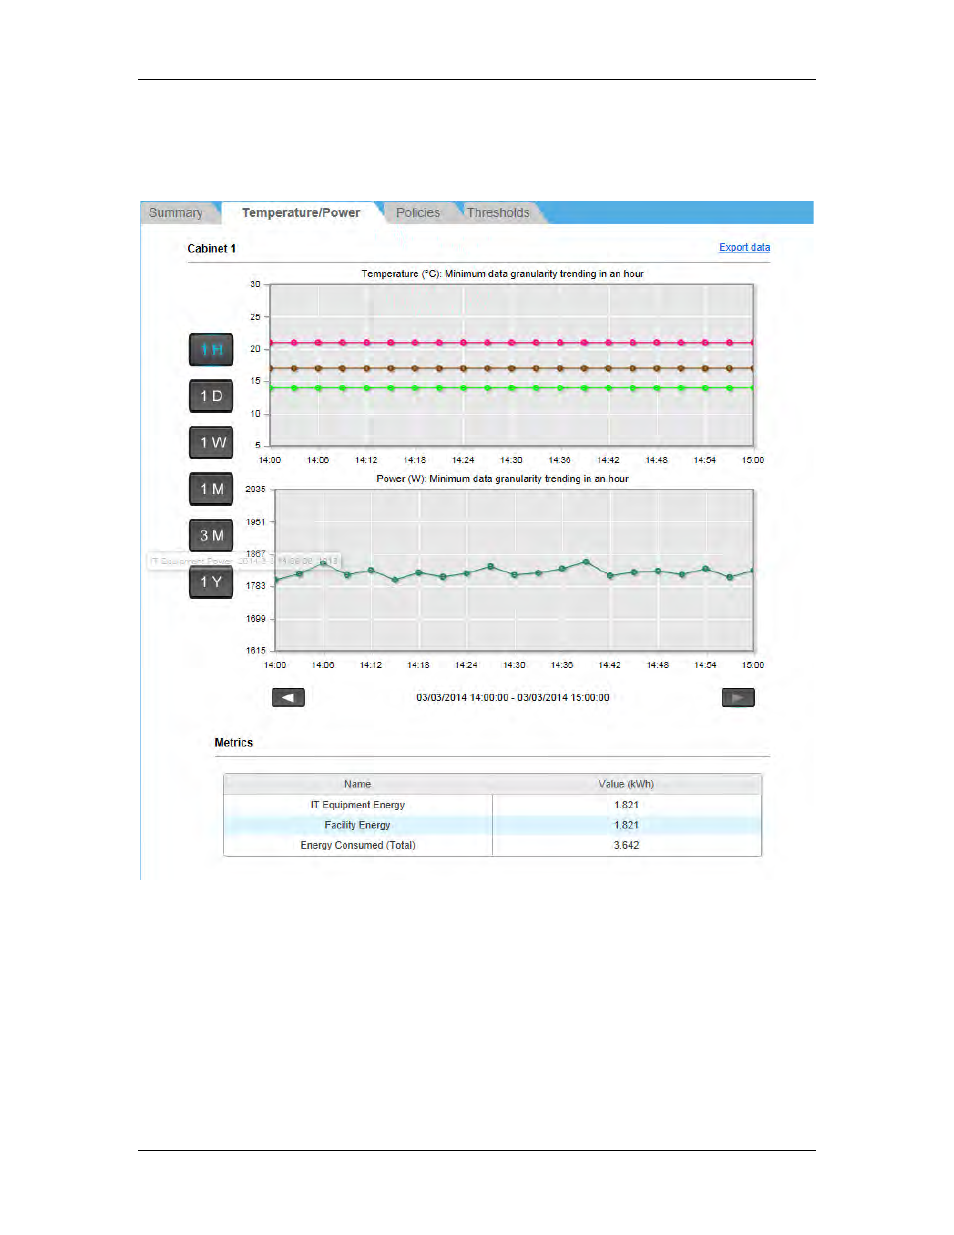
Power/Temperature
Select an entity on the Datacenter Management page and then click the
Power/Temperature tab to view its power and temperature details.
Power and temperature data is plotted in the graphs with the corresponding data
granularities. When monitoring servers directly, CPU utilization data is plotted if in-band
OS information is specified for the given server.
In the temperature figure:
•
The Highest Inlet Temperature is plotted in pink.
•
The Lowest Inlet Temperature is plotted in green.
•
The Average Inlet Temperature is plotted in brown.
In the power figure:
•
The Highest Power Consumption is plotted in red.
•
The Lowest Power Consumption is plotted in cyan (blue-green).
•
The IT Equipment Energy is plotted in brown.