Chatsworth Products CPI Power Management Tool User Manual
Page 39
Power Management Tool Manual
March 2014
Chatsworth Products, Inc.
(CPI)
39
NOTE
After a policy is enforced on the entity selected, Requested Power Cap is plotted in
purple in the power trending graph.
You can view the power/temperature values by hovering your mouse over the data
points in the curves.
By default, the power and temperature figures display the trending data of the recent
hour. You can click the arrow buttons “<” and “>” to view the data in the previous and
next time window, or switch to display the data in different time windows by clicking the
corresponding buttons.
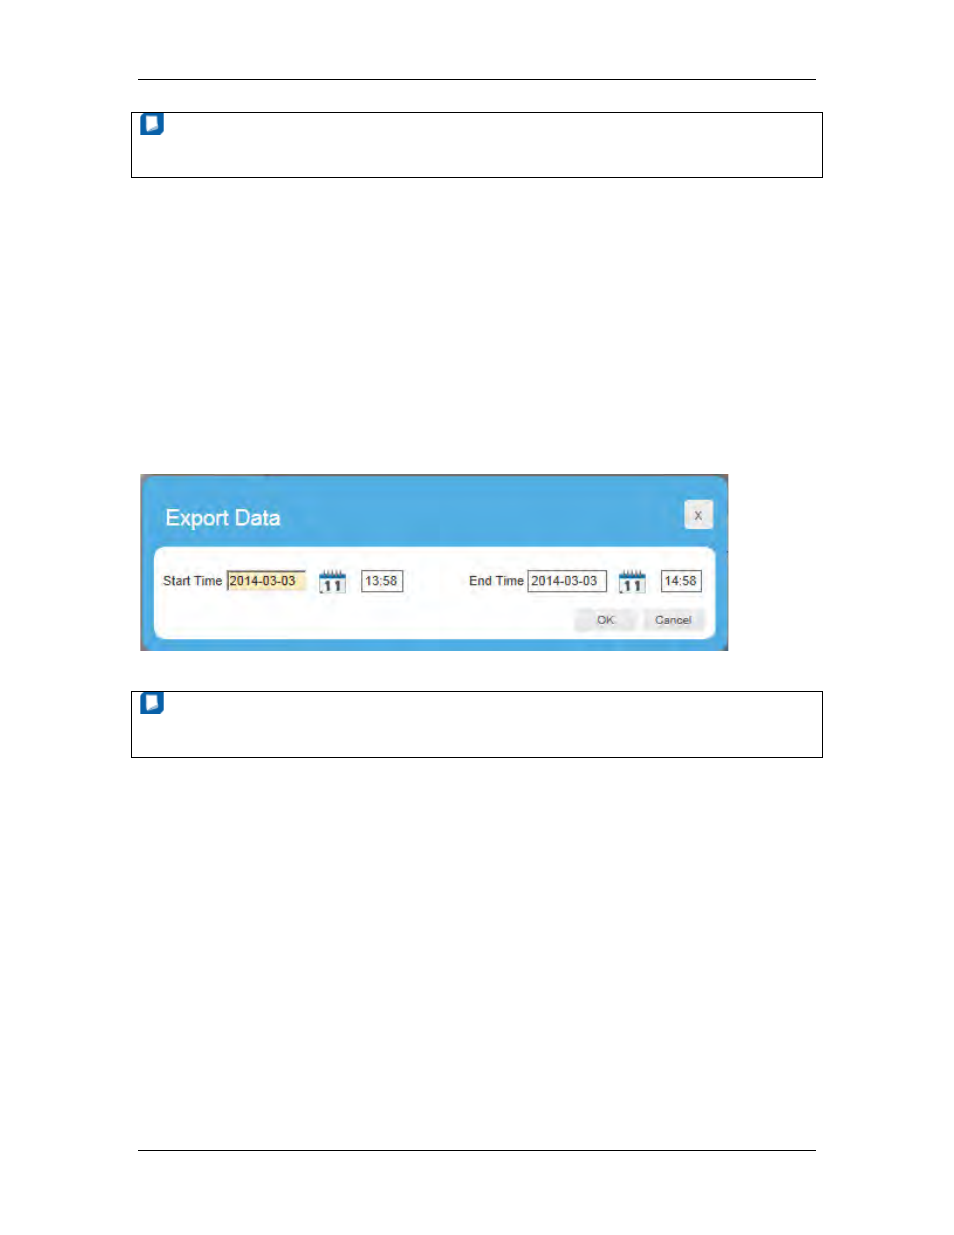
You can save the measurement data in an Excel file so that the managers can analyze
the data more conveniently. Click the Export measurement data link on the top of the
Temperature/Power tab.
Choose the start and end time for data exporting. Then click OK.
NOTE
The corresponding data granularity of a different time window size is different, and is
explicitly shown in the figures.