Summary – Chatsworth Products CPI Power Management Tool User Manual
Page 34
Power Management Tool Manual
March 2014
Chatsworth Products, Inc.
(CPI)
34
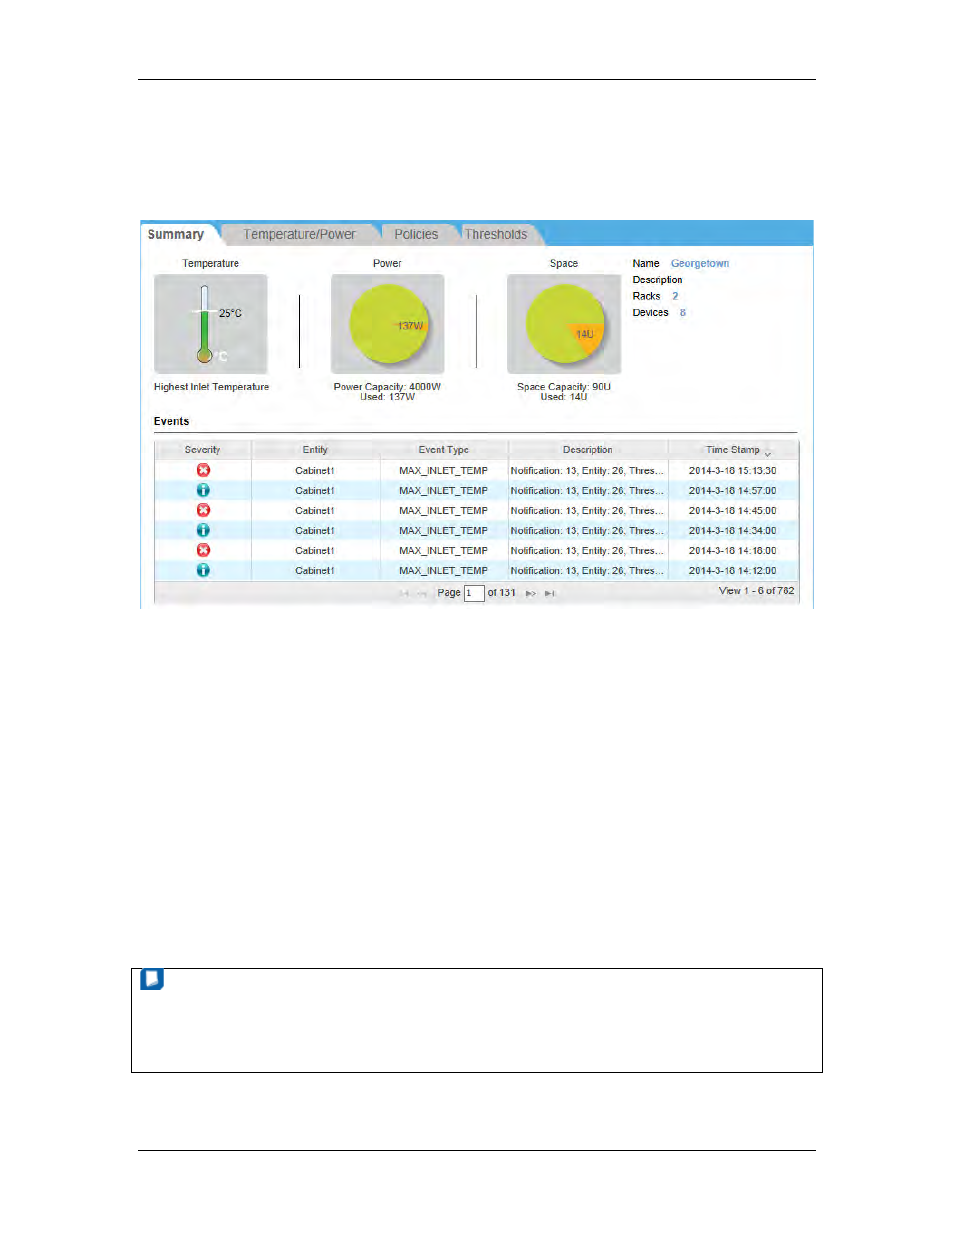
Summary
The Summary tab on the Datacenter Management page displays detailed information
about each entity, including temperature, power, space and events, etc.
Summary of a Data Center
The Summary tab of the Data Center selected on the Datacenter Management page
displays the following information (see image above):
•
Highest inlet temperature
•
The power capacity currently consumed against the power unused
•
The space capacity currently consumed against the space unused
•
The total numbers of racks and devices in the DC
In most of the cases, the thermometer in the Temperature graph is shown in green.
The pie charts in the Power and Space graphs show the power and space capacity of
the data center selected. The unused capacity is plotted in green and the capacity in use
is plotted in orange.
The Events tab lists all the events for the DC.
NOTE
The thermometer in the Temperature graph may turn red if the Highest Inlet
Temperature becomes higher than 27 degrees or the limit designated in Settings.
The pie charts in the Power and Space graphs may turn red if the amount in use is
greater than the capacity configured.