Flytec 6030-gps, 5 flight optimisation – Flytec 6030 * User Manual
Page 52
Flytec 6030-GPS
52 / 62
The GPS module in the Flytec barographs makes no averaging in the horizontal position,
but a slight averaging of around 5 seconds in the vertical position. The poorer the satellite
reception, the longer the delay.
9.5 Flight
Optimisation
9.5.1 Polar curve and Speed to Fly
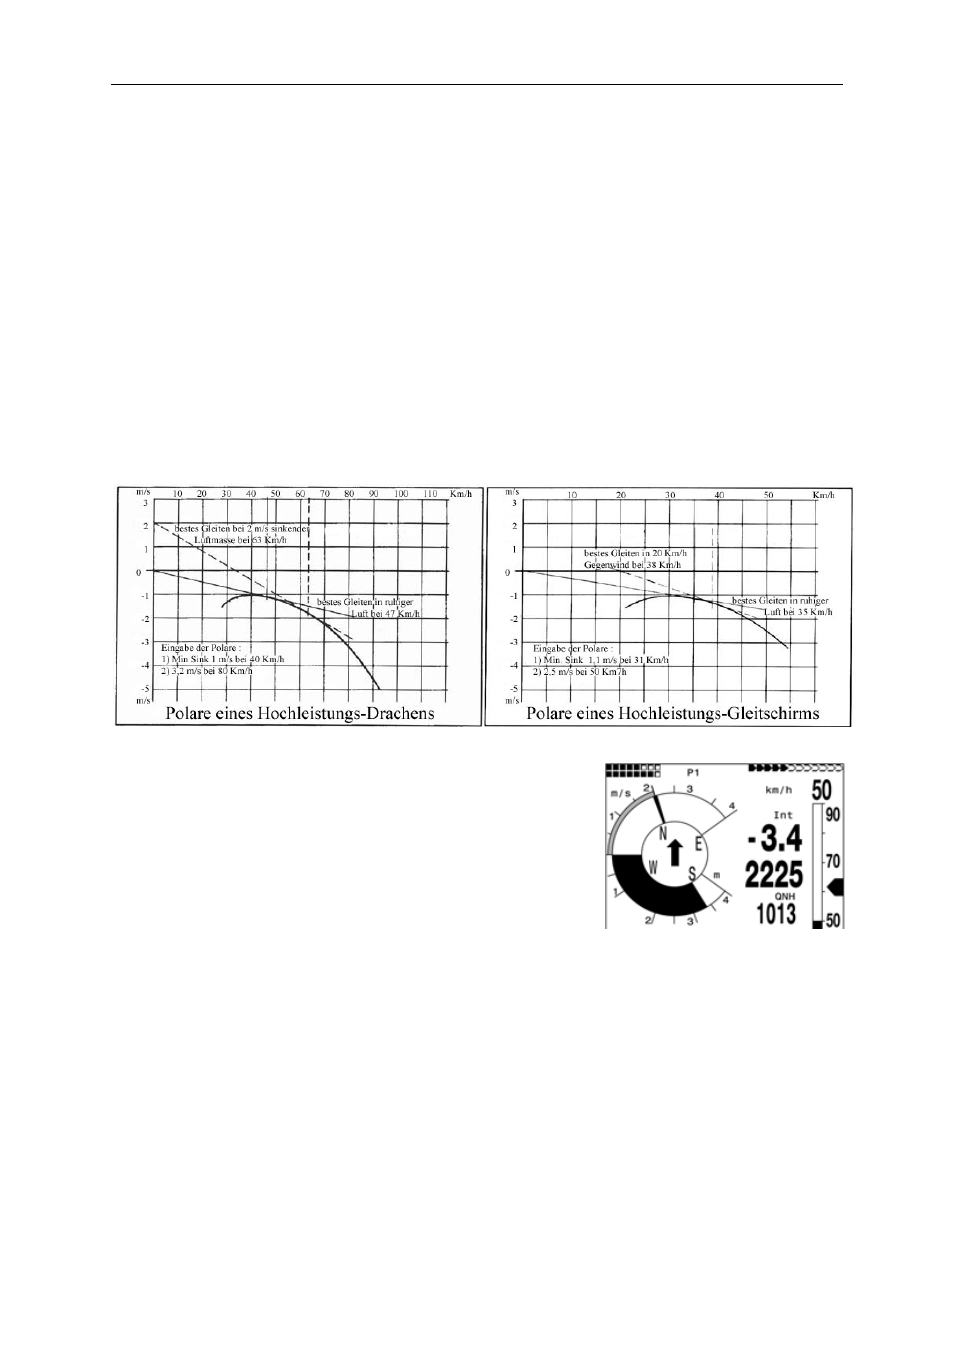
The polar curve of a glider is presented as a diagram. It shows directly the coherence
between flight speed and related sink rate. It provides the best information about the
efficiency of an aircraft. Based on the polar curve the minimum sink rate and the related
speed may be read immediately. If one plots a tangent from the diagram’s zero point to
the polar curve, then the tangential point is the result of best glide in calm air. If this speed
value is divided by the related sink rate, it will result in the ratio for best glide. (Of course,
both values need to be offset with the same units).
Best Glide: 47 / (3,6 x 1,2) = 10,9
Best Glide: 35 / (3,6 x 1,3) = 7,5
When the FLYTEC 6030 GPS is switched-on the polar curve
as entered is calculated and then stored in the instrument’s
memory as a very accurate chart. The instrument knows
immediately at any given flight speed how strong the related
sink rate should be. If the sink rate measured by the Vario
meter is higher than the chart value, the pilot is in sinking air.
If for instance, the Vario meter reports for a.m. glider at
speed of 35 km/h a sink rate of only 0,5 m/s, then the pilot
needs to be in ascending air of 1,3 – 0,5 = 0,8 m/s.
This value is also displayed by the Netto-Vario (see 9.2.1 gross - Netto Vario).
Now because the FLYTEC 6030 GPS also knows the rise or sink rate of the surrounding air
mass, it can continuously plot new tangent lines to the polar curve, in order to indicate for
any
given situation the speed of best glide. In the a.m. example for the hang glider the dotted
drawn tangent is allocated to an air mass sink rate of 2 m/s. The required Speed to Fly value
for this is 63 km/h. As Speed to Fly is designated the kind of speed which provides to the
pilot always the ratio for best glide. He will arrive for example after a valley crossing at higher
altitude than his colleagues who just fly with their sense (under otherwise same conditions).
The pilot of our example on the right flies much too slowly, he will loose time and height,
because he stays too long in sinking air. If this pilot would fly faster than 63 km/h as indicated
by the instrument, he would also arrive at lower altitude as the colleague flying with optimal
speed (here 63 km/h).
For the above illustrated glider polar curves the dotted tangent is drawn for a head wind of
20 km/h. It is obvious that the best glide is now provided at 38 km/h. If the pilot flies with