HP XP P9000 for Compatible High Perf FICON Connectivity Software User Manual
Page 19
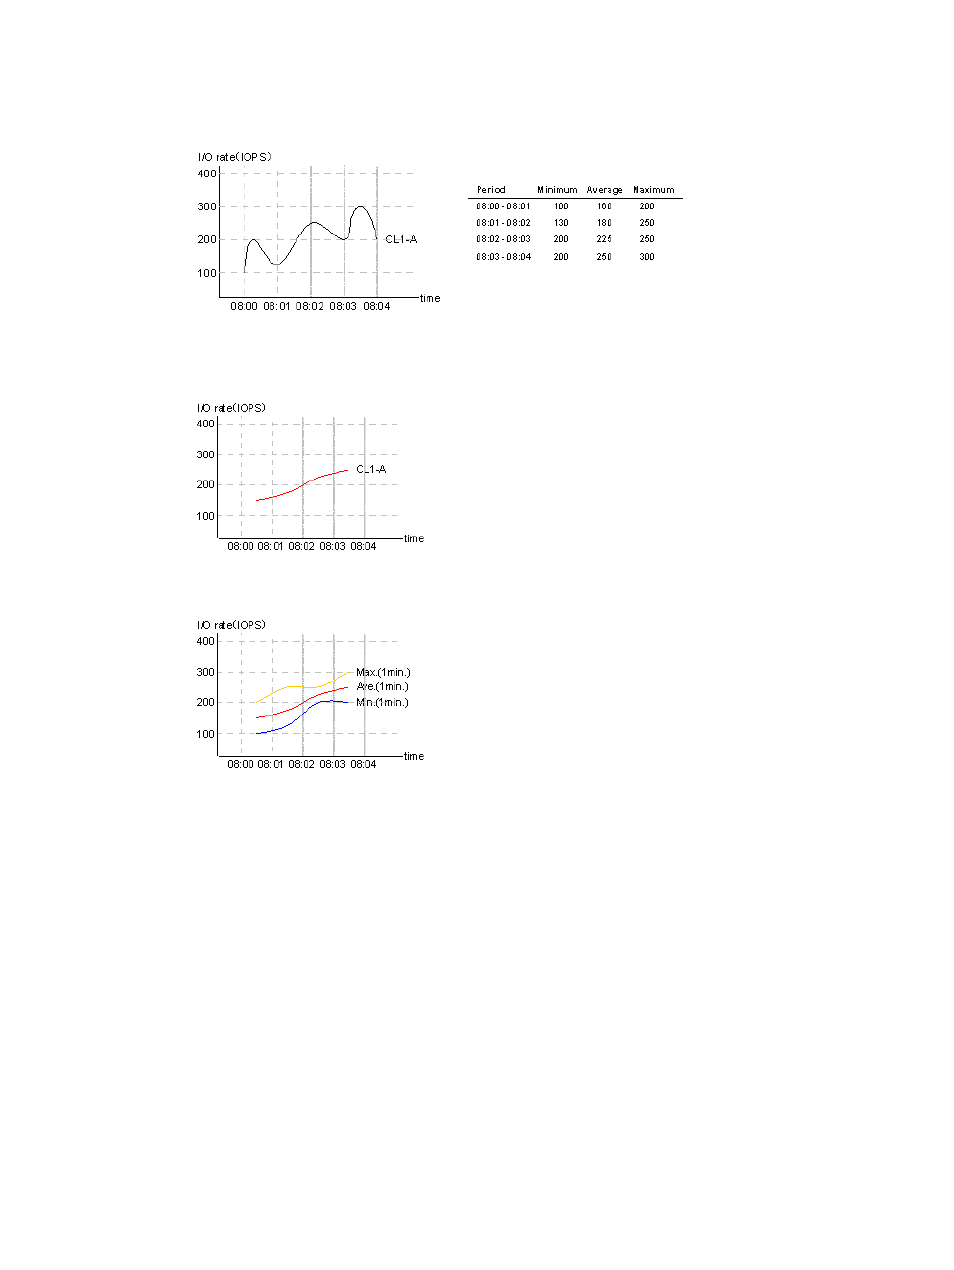
somewhere around 150 I/Os. It is possible that the lines Max (1 min.) and Min (1 min.) in
Graph 3 might exceed the upper limit.
Figure 3 Graph 1: actual I/O rate (measured every second)
Figure 4 Graph 2: I/O rate displayed in Performance Monitor (the Detail check box is not
selected)
Figure 5 Graph 3: I/O rate displayed in Performance Monitor (the Detail check box is selected)
Using Performance Control
19
This manual is related to the following products:
See also other documents in the category HP Storage:
- StorageWorks MSL6000 Tape Library (61 pages)
- Лент-е накопители HP StoreEver DAT (64 pages)
- Лент-е накопители HP StoreEver DAT (50 pages)
- StoreEver TapeAssure Software (40 pages)
- StoreEver Ultrium Tape Drives (75 pages)
- StoreEver Ultrium Tape Drives (60 pages)
- Linear Tape File System Software (28 pages)
- Linear Tape File System Software (25 pages)
- StoreEver Ultrium Tape Drives (78 pages)
- StoreEver Ultrium Tape Drives (76 pages)
- Linear Tape File System Software (20 pages)
- StoreEver Ultrium Tape Drives (61 pages)
- 2600fx Optical Disk Drive (65 pages)
- Ленточный автозагрузчик HP StorageWorks DAT 72x10 (58 pages)
- StorageWorks 1500cs Modular Smart Array (52 pages)
- StorageWorks 1500cs Modular Smart Array (71 pages)
- 2000fc Modular Smart Array (150 pages)
- StorageWorks 1000 Modular Smart Array (72 pages)
- StorageWorks 1000 Modular Smart Array (81 pages)
- StorageWorks 1500cs Modular Smart Array (48 pages)
- Servidor de almacenamiento HP ProLiant DL585 G2 (152 pages)
- Sistemas de almacenamiento de red HP StorageWorks X3000 (152 pages)
- Software de HP StoreVirtual VSA (127 pages)
- Software de HP StoreVirtual VSA (85 pages)
- X500 Data Vault (331 pages)
- StorageWorks 1000i Virtual Library System (122 pages)
- StorageWorks XP Remote Web Console Software (20 pages)
- 200 Storage Virtualization System (176 pages)
- XP Array Manager Software (101 pages)
- StorageWorks MSA 2.8 SAN Switch (307 pages)
- StorageWorks MSA 2.8 SAN Switch (22 pages)
- StorageWorks MSA 2.8 SAN Switch (104 pages)
- StorageWorks MSA 2.8 SAN Switch (270 pages)
- StorageWorks All-in-One SB600c Storage Blade (72 pages)
- StorageWorks All-in-One SB600c Storage Blade (80 pages)
- StorageWorks All-in-One SB600c Storage Blade (78 pages)
- StorageWorks All-in-One SB600c Storage Blade (60 pages)
- ProLiant DL585 G2 Storage-Server (150 pages)
- Data Protector Express Basic-Software (83 pages)
- Data Protector Express Basic-Software (93 pages)
- ProLiant DL185 G5 Storage Server (174 pages)
- ProLiant High Availability Storage Server (72 pages)
- 2000I G2-Modular-Smart-Array (48 pages)
- P2000 G3 MSA Array Systems (58 pages)
- StorageWorks 2000fc G2 Modular Smart Array (76 pages)