Type-ii graphs – HP NonStop G-Series User Manual
Page 47
interval than at the start.
In such a case, where negative values are being reported, you might notice that:
a) If the Graph floor is set to "Zero", the negative value point will not be plotted.
b) If the Graph floor is set to "Minimum value", the graph will adjust itself to
show the negative values.
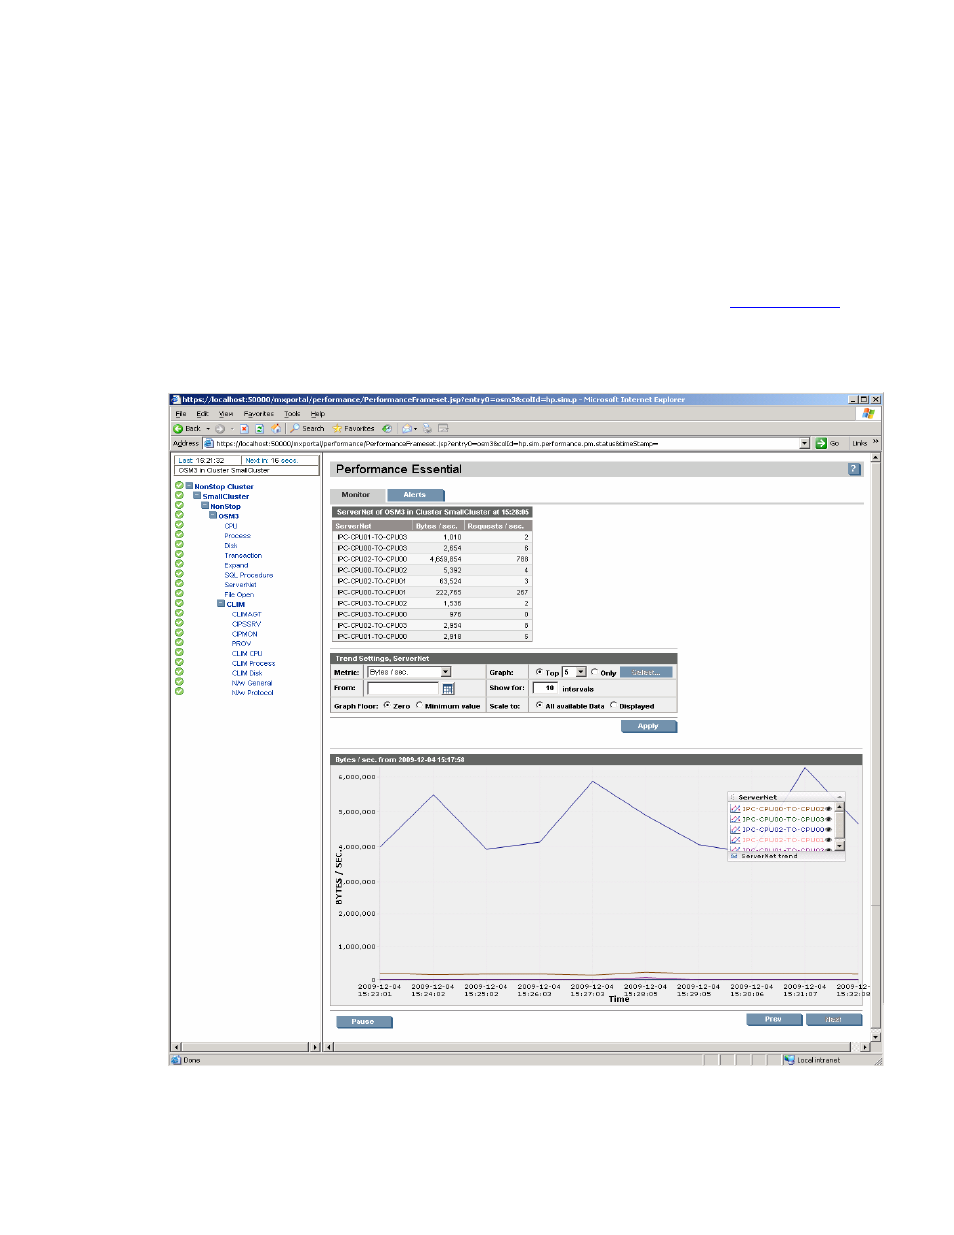
5.3.2. Type-II Graphs
Figure 10 – Type-II Graph
Performance Essentials HP SIM Client and NonStop & Linux Host User Guide – 544813 – 004
47
This manual is related to the following products:
See also other documents in the category HP Computer hardware:
- xt1500 (58 pages)
- LaserJet 4700 (68 pages)
- ProLiant BL460c Gen8 Server Blade (67 pages)
- ProLiant DL360 Server (16 pages)
- ProLiant BL460c Gen8 Server Blade (65 pages)
- ProLiant DL388p Gen8 Server (128 pages)
- ProLiant BL465c Server Blade (87 pages)
- ProLiant DL388p Gen8 Server (47 pages)
- ProLiant BL40p Server series (73 pages)
- ProLiant ML115 Server (63 pages)
- ProLiant DL140 G2 Server (81 pages)
- Servidor HP ProLiant ML370 G4 (20 pages)
- Servidor HP ProLiant ML370 G4 (30 pages)
- Servidor HP ProLiant DL160 G5p (84 pages)
- Servidor HP ProLiant DL980 G7 (143 pages)
- Servidor HP ProLiant DL380 G5 (137 pages)
- Integrity rx2620 Servers (53 pages)
- Integrity rx2620 Servers (24 pages)
- Integrity rx2620 Servers (33 pages)
- Integrity rx2620 Servers (100 pages)
- Integrity rx2620 Servers (37 pages)
- Integrity Superdome sx1000 Server (53 pages)
- Integrity rx2620 Servers (37 pages)
- Integrity rx2620 Servers (58 pages)
- Integrity rx2620 Servers (77 pages)
- Integrity rx2620 Servers (107 pages)
- Integrity rx2620 Servers (55 pages)
- 9000 rp3440 Servers (36 pages)
- Integrity rx2620 Servers (42 pages)
- Integrity rx2620 Servers (48 pages)
- Servidor HP ProLiant DL360p Gen8 (129 pages)
- Servidor HP ProLiant DL120 G6 (133 pages)
- ProLiant DL580 Gen8 Server (91 pages)
- ProLiant MicroServer Gen8 (95 pages)
- ProLiant MicroServer (94 pages)
- ProLiant BL685c G5 Server Blade (99 pages)
- ProLiant Firmware Maintenance CD (87 pages)
- ProLiant BL10e Server Blade (232 pages)
- ProLiant BL40p Server series (30 pages)
- Serveur lame HP ProLiant BL680c G5 (90 pages)
- Serveur lame HP ProLiant BL465c Gen8 (578 pages)
- ProLiant DL320e Gen8 Server (96 pages)
- ProLiant ML110 G7 Server (113 pages)
- 9000 rp8420 Servers (38 pages)
- Integrity Superdome sx1000 Server (19 pages)