Type-i graphs – HP NonStop G-Series User Manual
Page 45
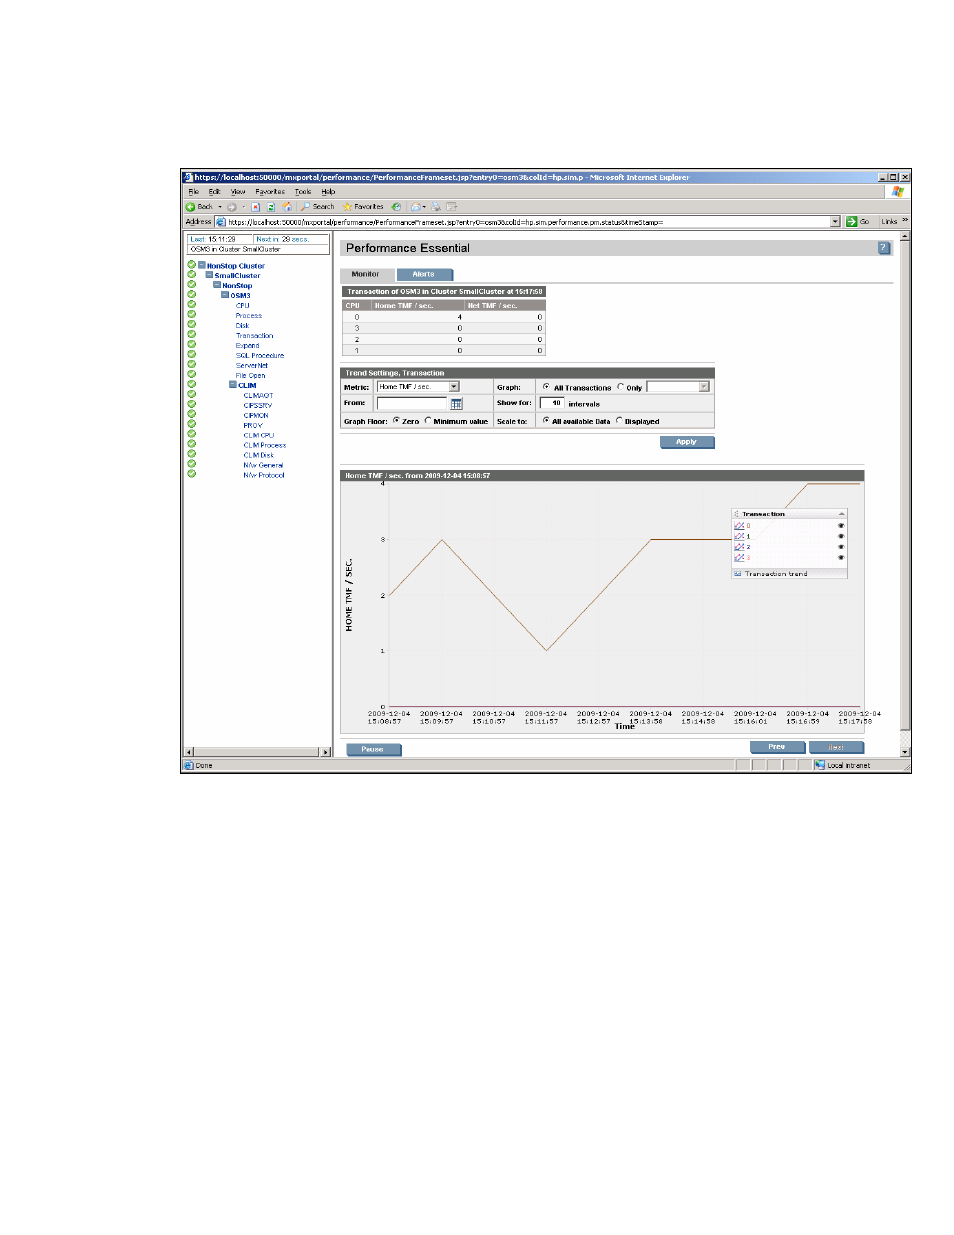
5.3.1. Type-I Graphs
Figure 9 – Type-I Graph
Setting options:
Metric/Param
Specific or All objects
Date / Time to start the display from
Number of intervals to show on the graph
Whether the graph floor (minimum value of Y-axis) is set to zero or the
lowest of the displayed values.
Whether the scale (maximum value of y-axis) is set to 100% (when % is
reported) or the maximum of all available values in the trend database for
the displayed objects.
Performance Essentials HP SIM Client and NonStop & Linux Host User Guide – 544813 – 004
45
This manual is related to the following products:
See also other documents in the category HP Computer hardware:
- xt1500 (58 pages)
- LaserJet 4700 (68 pages)
- ProLiant BL460c Gen8 Server Blade (67 pages)
- ProLiant DL360 Server (16 pages)
- ProLiant BL460c Gen8 Server Blade (65 pages)
- ProLiant DL388p Gen8 Server (128 pages)
- ProLiant BL465c Server Blade (87 pages)
- ProLiant DL388p Gen8 Server (47 pages)
- ProLiant BL40p Server series (73 pages)
- ProLiant ML115 Server (63 pages)
- ProLiant DL140 G2 Server (81 pages)
- Servidor HP ProLiant ML370 G4 (20 pages)
- Servidor HP ProLiant ML370 G4 (30 pages)
- Servidor HP ProLiant DL160 G5p (84 pages)
- Servidor HP ProLiant DL980 G7 (143 pages)
- Servidor HP ProLiant DL380 G5 (137 pages)
- Integrity rx2620 Servers (53 pages)
- Integrity rx2620 Servers (24 pages)
- Integrity rx2620 Servers (33 pages)
- Integrity rx2620 Servers (100 pages)
- Integrity rx2620 Servers (37 pages)
- Integrity Superdome sx1000 Server (53 pages)
- Integrity rx2620 Servers (37 pages)
- Integrity rx2620 Servers (58 pages)
- Integrity rx2620 Servers (77 pages)
- Integrity rx2620 Servers (107 pages)
- Integrity rx2620 Servers (55 pages)
- 9000 rp3440 Servers (36 pages)
- Integrity rx2620 Servers (42 pages)
- Integrity rx2620 Servers (48 pages)
- Servidor HP ProLiant DL360p Gen8 (129 pages)
- Servidor HP ProLiant DL120 G6 (133 pages)
- ProLiant DL580 Gen8 Server (91 pages)
- ProLiant MicroServer Gen8 (95 pages)
- ProLiant MicroServer (94 pages)
- ProLiant BL685c G5 Server Blade (99 pages)
- ProLiant Firmware Maintenance CD (87 pages)
- ProLiant BL10e Server Blade (232 pages)
- ProLiant BL40p Server series (30 pages)
- Serveur lame HP ProLiant BL680c G5 (90 pages)
- Serveur lame HP ProLiant BL465c Gen8 (578 pages)
- ProLiant DL320e Gen8 Server (96 pages)
- ProLiant ML110 G7 Server (113 pages)
- 9000 rp8420 Servers (38 pages)
- Integrity Superdome sx1000 Server (19 pages)