History data display – Watlow Silver Series User Manual
Page 171
Bar Graphs, Meters, and Trends
163
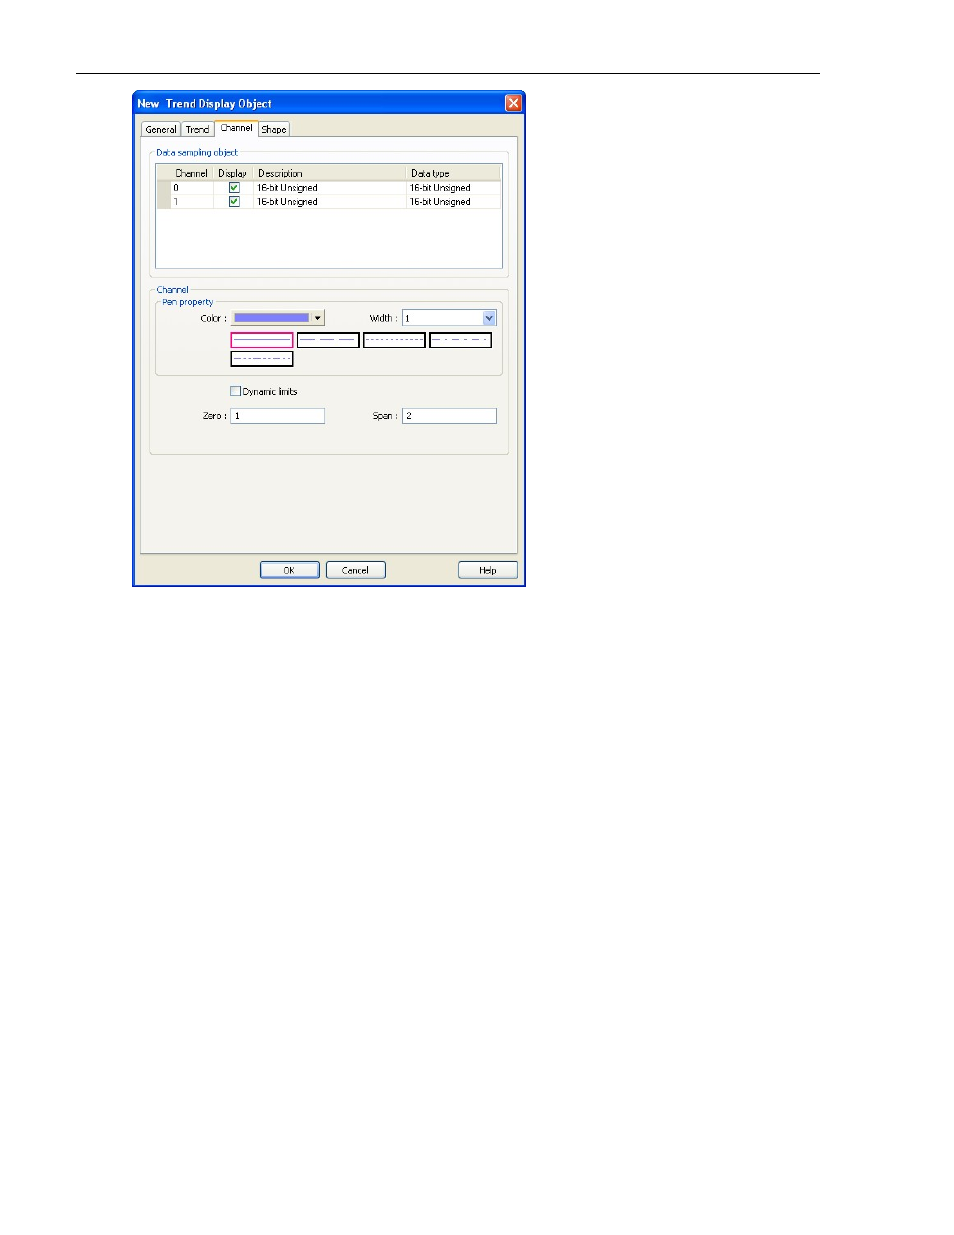
13. In the Data sampling object section, select the channels you want to display by clicking the checkboxes
under Display. Select the pen properties for the selected channel in the Channel section.
14. Next, select the value at which the pen will be at the bottom of the display (Zero) and where the pen will be
at the top of the display (Span).
15. Click the Shape tab to configure a different frame style or color for the display, if desired.
16. Click OK and click to place the Trend Display on EasyBuilder's work area. If you'd like to reconfigure any of its
properties, double-click on the trend to display the Trend Display Object's Properties Dialog. Click the Profile
tab if you'd like to resize or re-position your trend using the Width/Height and X/Y position boxes instead of
dragging and placing it in the work area.
History Data Display
The History Data Display shows data captured by the Data Sampling object.
Data is displayed in tabular format with the option to show the time and date of when data was captured. A control
register is used to determine which historical data record is displayed (i.e., most recent, yesterday, two days ago, etc.)
based upon date of capture.
1010-1007, Rev. 10