Watlow Silver Series User Manual
Page 14
6
EZware5000 Series Programming Manual
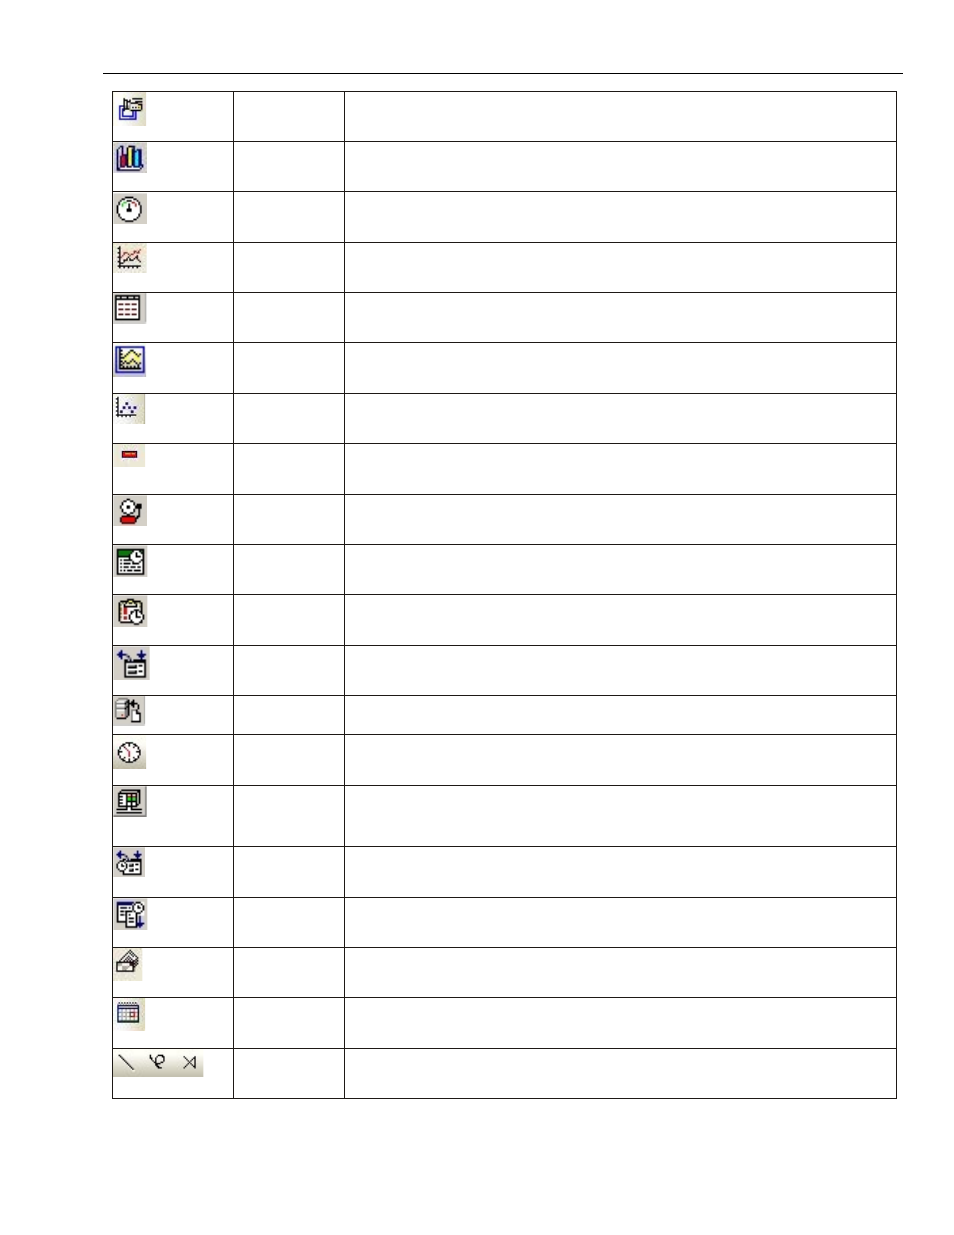
Video In
Input and play video on the HMI from an external source (X-models only).
Bar Graph
Creates a bar graph with alarm monitoring.
Meter Display Creates a scale meter.
Trend Display
Creates a trend graph. Samples data in single or multiple 16-bit PLC registers
and plots the data on a time graph.
History Data
Display
Displays historical data in a tabular format.
Data Block
Display
Displays the data stored in a series of registers as a line graph.
XY Plot
Creates an XY Plot of data stored in a series of registers.
Alarm Bar
Displays alarms detected by the Alarm (Event) Log Object on a single horizontal
scrolling line.
Alarm Display
Display alarms detected by the Alarm (Event) Log Object in a table format.
Event Display
Displays messages detected in the Alarm (Event) Log and can acknowledge the
message(s).
Alarm (Event)
Log
Contains the data for detecting alarm conditions.
Data Transfer
(Trigger-based)
Transfers data to the specified PLC registers based on a touch or PLC bit status.
Backup
Copies recipe, event, or historical data to one of the USB flash drives or to a PC
connected via Ethernet.
Timer
Controls an internal bit or PLC bit based on a timer; supports five different
configurations.
PLC Control
Configures the HMI to monitor PLC data registers to display full window screens,
execute a data transfer, control the backlight, play a sound, execute a macro,
or print a screen.
Data Transfer
(Time-based)
Transfers data to the specified PLC registers on a timed basis.
Data Sampling Stores data for trending and archiving.
System Message Customizes the content of system-generated messages.
Scheduler
Performs an action based upon a time schedule.
Drawing Tools Includes Line, Arbitrary Line, Link Line, Arc, Ellipse/Circle, Pie, Rectangle, Polygon,
Scale, Text, Picture, Shape.
1010-1007, Rev. 10