Teledyne LeCroy BTTracer_Trainer - BTTracer Users Manual User Manual
Page 179
169
BTTracer Protocol Analyzer User’s Manual
CATC
SW Version 2.20
Real-Time Statistical Monitor Pop-up Menu
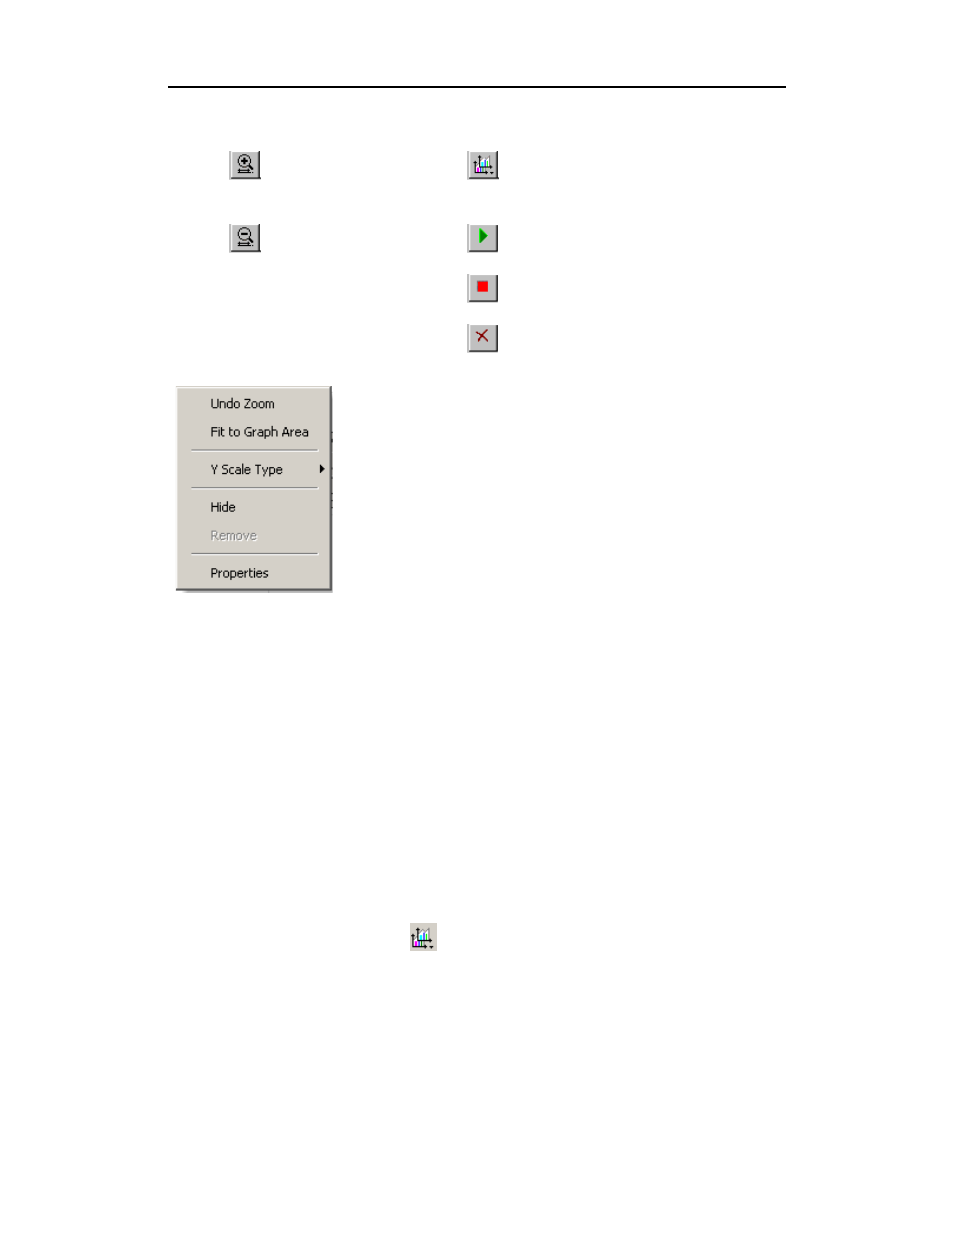
If you right-click a graph in the Real-Time window, a
pop-up menu will appear with options for changing the
format of the display.
Undo Zoom - If you have zoomed in, this command will
undo the zoom.
Fit to Graph Area - Redisplays graph so that the entire
trace fits inside graph area.
Y Scale Type -·
Linear - Converts display to linear format.
Logarithmic - Converts display to logarithmic format.
Hide - Hides the selected graph.
Properties - Opens a dialog box with options for changing the colors, titles
and other features of the graphs.
Displaying Multiple Graphs
The Real Time Statistics window gives you the ability to create up to three
separate graphing windows so that you can create separate graphs of traffic
and tile them vertically. Within these windows, you can format the graphs
in a number of ways.
• To view two or three graphs simultaneously, click the Graph
Areas button.
A menu opens with the following graph options:
•
General Statistics
•
Packet Occurrence (rate)
•
Errors Occurrence (rate)
Horizontal zoom in
Graph Areas - Presents options for
displaying additional graphs of data lengths,
packet lengths, and percentage of bus
utilized.
Horizontal zoom out
Start. Starts the Real-Time Monitor.
Stop Real-Time Monitoring.
Reset. Resets the graphs.