Teledyne LeCroy BTTracer_Trainer - BTTracer Users Manual User Manual
Page 178
168
BTTracer Protocol Analyzer User’s Manual
CATC
SW Version 2.20
To display the Real-Time Statistics window, click
in the Tool Bar.
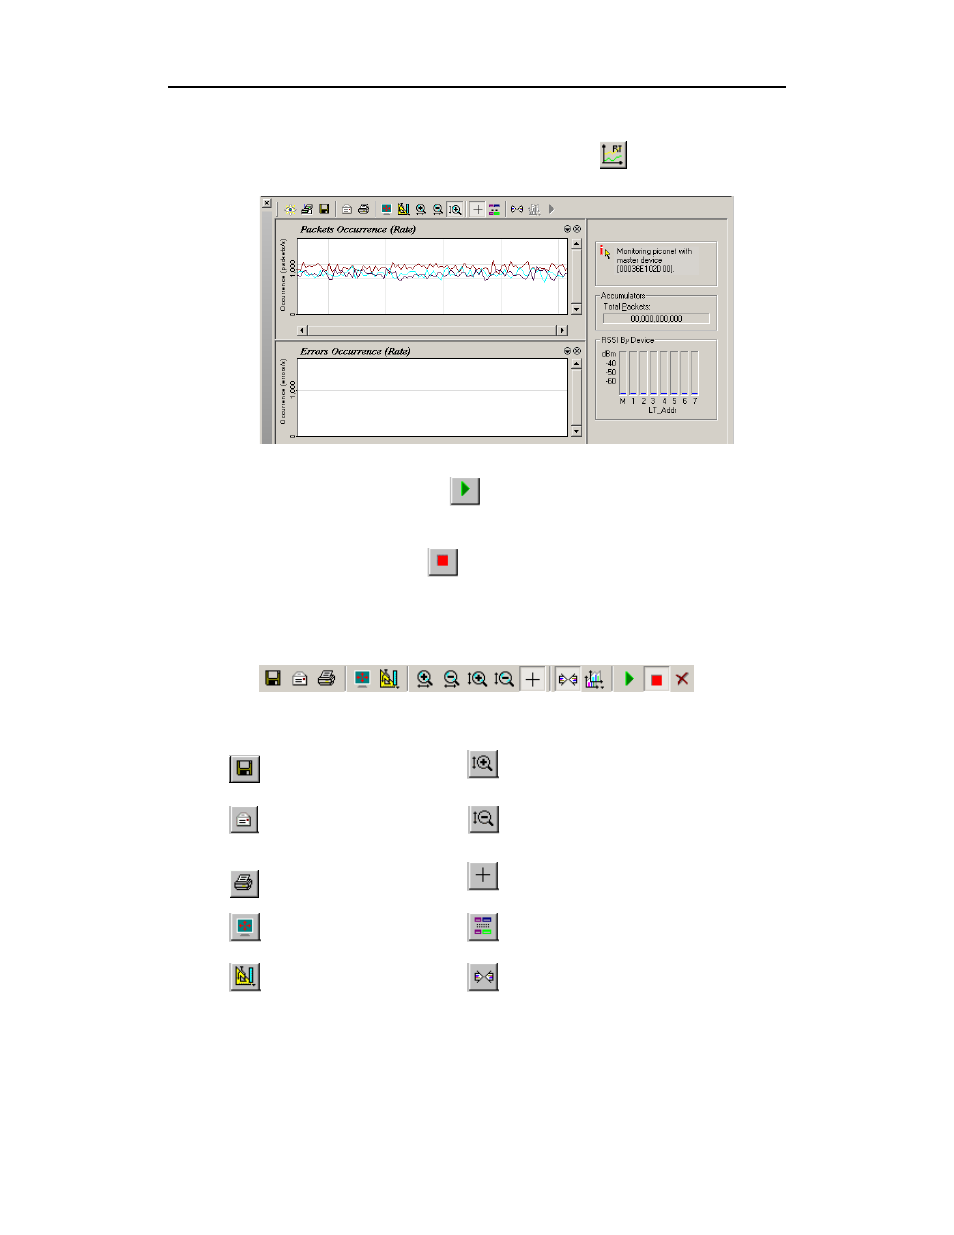
The Real Time Statistics window opens:
In order to see a graph of traffic, you will need to start recording. After
starting piconet activity, press
to start the Real-Time statistics monitor.
BTTracer will then synchronize to the piconet and stream data in real time
to this window and presented in a format of your choice.
To stop the monitor, press
.
Real-Time Statistics Buttons
The Real-Time Statistics toolbar has buttons for changing the format of the
displayed data and for exporting data:
The buttons have the following functions:
Save As - Saves Real-Time
graphs as bitmap files
(*.bmp)
Vertical zoom in
Email - Creates an email
with a *.bmp file attachment
of the graphs
Vertical zoom out
Click and Drag zoom - Click diagonally to
select and zoom in on part of the graph
Full Screen
Select Range
View Settings - opens a
sub-menu with options for
formatting the display.
Sync and Graph areas - If two or more
graphs are displayed, this button will
synchronize the graphs to one another. Once
synchronized, the positioning slider of one
graph will move the other graphs