Fft spectrum analyzer, Operator’s manual – Teledyne LeCroy WaveAce 1000_2000 User Manual
Page 57
Operator’s Manual
922131-00 Rev A
51
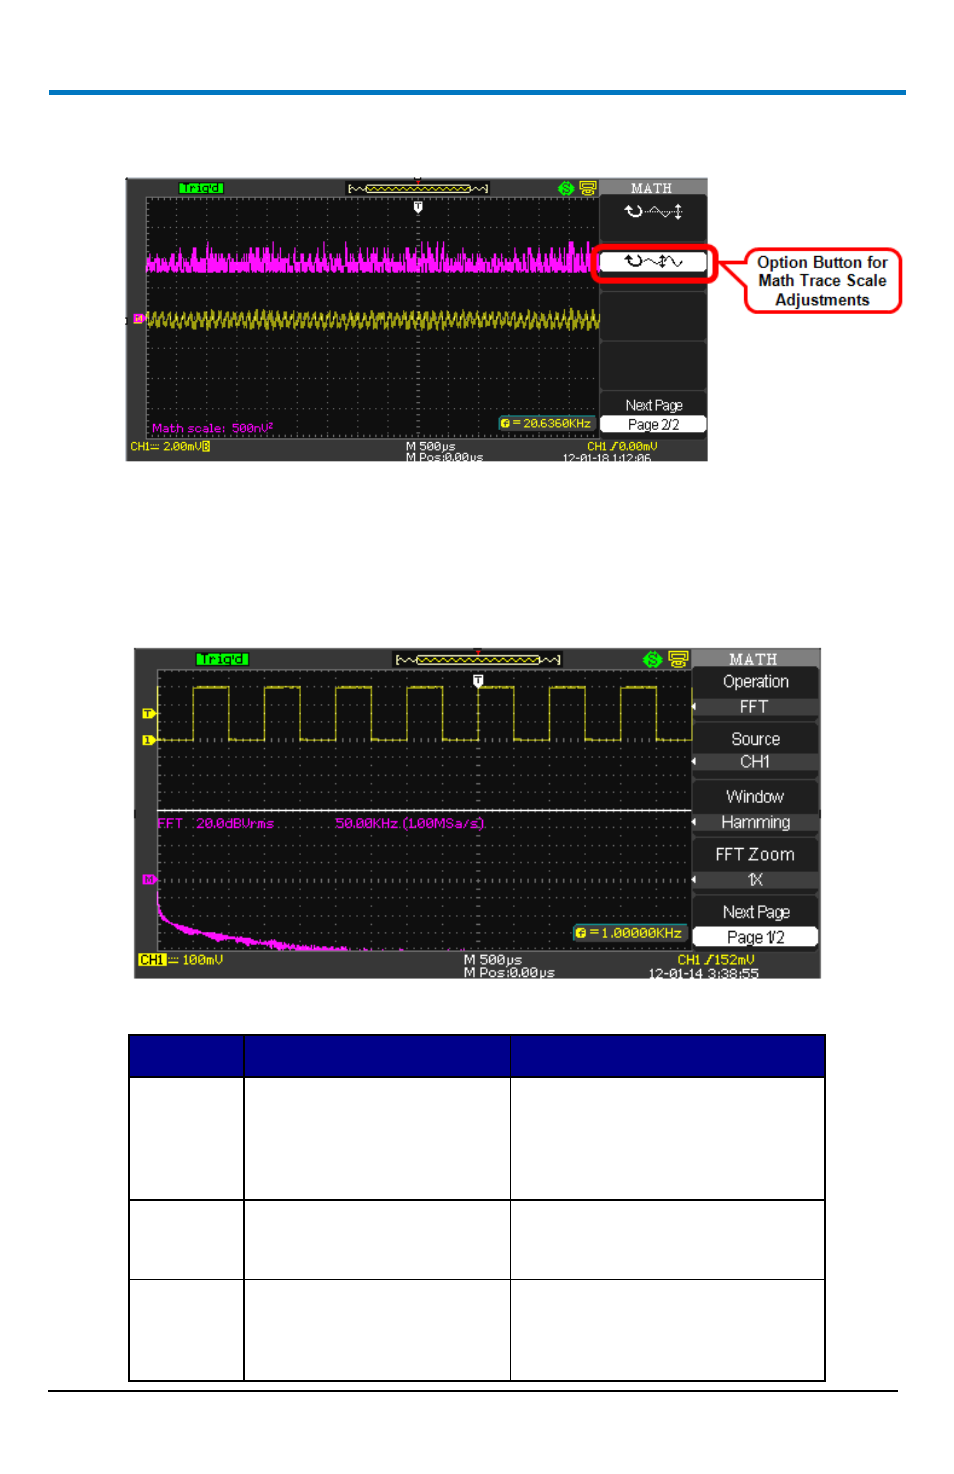
4. Adjust the scale of your math trace by pressing the following option
button and turning the Adjust knob as desired.
FFT Spectrum Analyzer
The FFT process mathematically converts a time-domain signal into its
frequency components. You can display only one FFT waveform at a time.
With the FFT Operation selected, the following menu options are shown.
1. Press the Window option button and select from the following choices.
Window Description
Test Content
Rectangular Best frequency resolution,
worst magnitude resolution.
This is essentially the same
as no window.
Symmetric transients or bursts.
Equal-amplitude sine waves with
fixed frequencies. Broadband
random noise with a relatively
slowly varying spectrum.
Hanning
Better frequency, worse
magnitude accuracy than
Rectangular.
Sine, periodic, and narrow-band
random noise. Asymmetric
transients or bursts.
Hamming
Better frequency, worse
magnitude accuracy than
Rectangular. Hamming has
slightly better frequency
Sine, periodic, and narrow-band
random noise. Asymmetric
transients or bursts.