20 interpreting qam constellation data – Alpha Technologies XP-EDH4 - Technical Manual User Manual
Page 60
60
745-419-B0-001 Rev. A (11/2013)
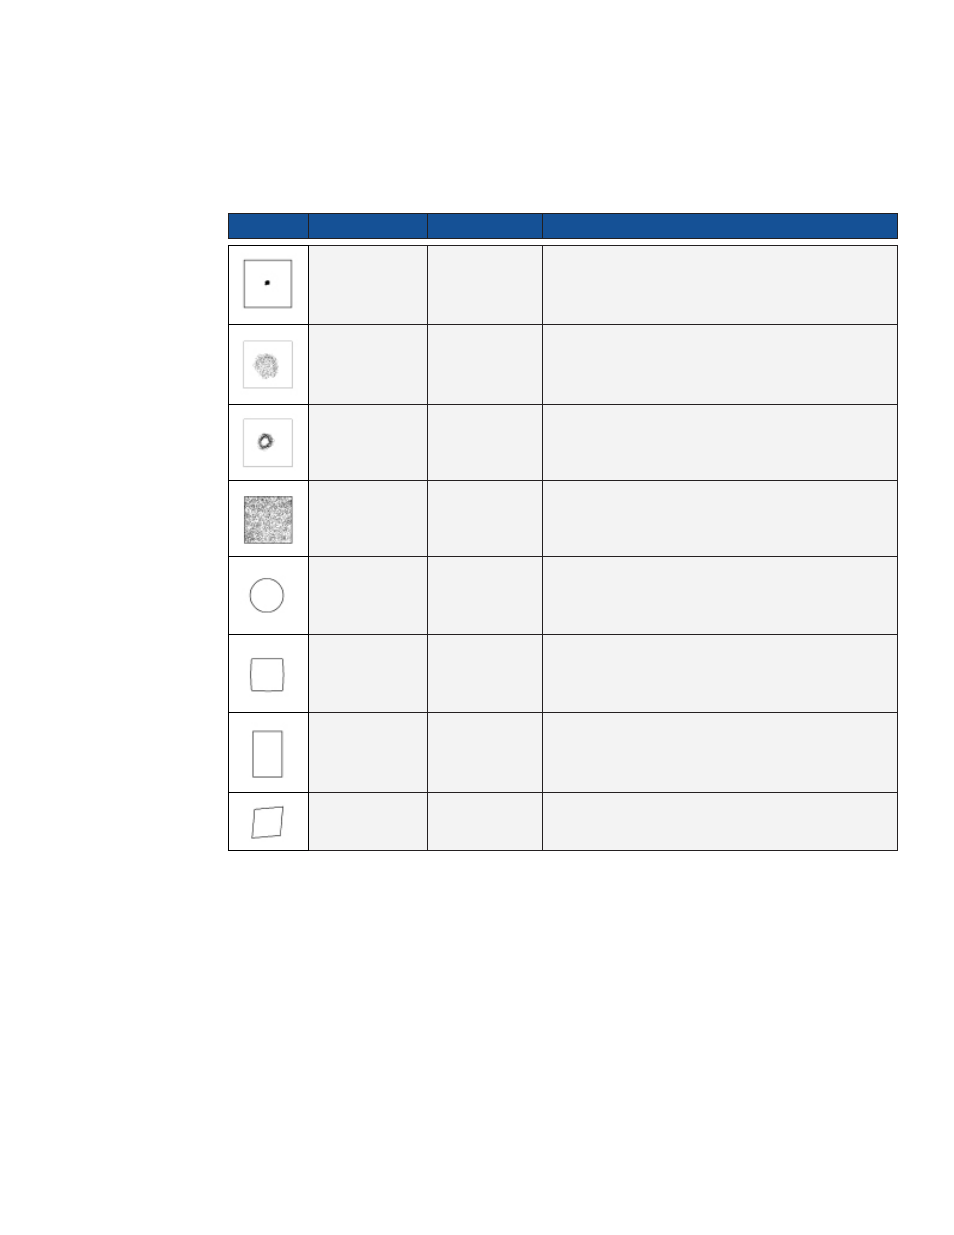
3.9.20 Interpreting QAM Constellation Data
The usefulness of the QAM constellation comes in the ability to recognize common shapes and
configurations within the map. Examples of the data shown in the table below are illustrated in the
figures that follow.
3.0
Configuration and Operation, continued
Table 3-10, Visual Cues for QAM Constellation Data
Shape
Focus
Impairment
Description
Individual cells
and entire QAM
constellation
Normal
Dots are centered in the individual QAM quadrants. The QAM
constellation has a uniform square shape.
Individual cells
Low CNR and/or
Low MER
Individual cells of QAM constellation contain a fuzzy and
diffused pattern.
Individual cells
Coherent
Interference
Individual cells of QAM constellation contain diffused hollow
circles or “doughnuts”. This indicates an interfering carrier and
shows the effect of not allowing the carrier to ever reach the
proper point in the target range.
Individual cells
Gaussian Noise
Individual cells contain a complete and fairly uniform smear up
to all decision boundaries, and is usually caused by improper
system setup, too many amplifiers in a cascade, damaged/
overheated hardware, and/or low power.
Entire QAM
constellation
Phase Noise
QAM constellation consists of smeared, concentric, circular
patterns.
Entire QAM
constellation
Gain Compression
QAM constellation looks uniformly square but the outside
corners appear to be “smashed” toward center of grid
(compression in the RF plant).
Entire QAM
constellation
I-Q Imbalance in
the Modulator
Overall appearance of QAM constellation is rectangular rather
than the desired square shape (square inequality).
Entire QAM
constellation
Quadrature
Distortion
Overall appearance of QAM constellation has a twisted or
skewed parallelogram shape.