Xylem 6-Series Multiparameter User Manual
Page 71
Sondes
Section 2
YSI Incorporated
Environmental Monitoring Systems Operations Manual
2-65
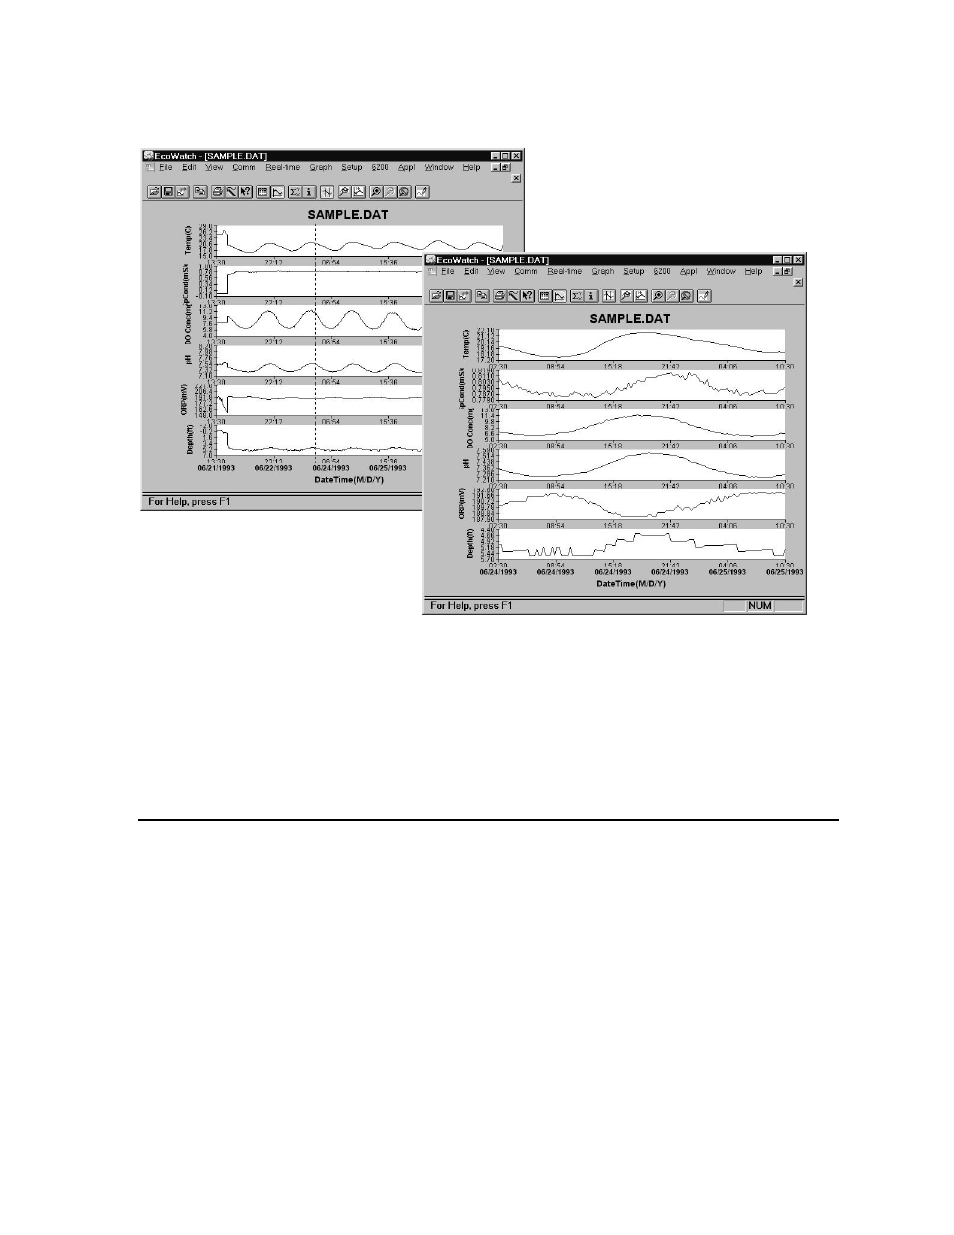
Figure 48 Using Limit Data Set to Display a Subset of Data
To return to the full set of data again, click on Graph, then Cancel Limits. If you desire a hard copy of
any graph or table, or even a subset expression as shown above, you may use the Edit, Copy command to
„copy‟ the graph in the active window to the “Clipboard”. You can then „paste‟ this graph to the Windows
application program of your choice. You may also be able to print graphs and tables as described in the
next section.
SAVE, IMPORT, EXPORT AND PRINT COMMANDS
Under File function in the top line menu, you can save a particular presentation version of a data file and
give the presentation a customized name. For example, you might want to call the expanded plot in Figure
48 “DIURNAL” using the File|Save Data Display command. This presentation will be saved with your
data file and can be recalled in further by using the File|Load Data Display command. You can also
export your custom data display as a spreadsheet compatible file (.CDF or .TXT) or print it to a compatible
printer. You may also create a custom report format using the File|Report command. See Figure 49 for
the File menu, which shows these commands. Use the Window‟s Help function to learn more about these
features.