Xylem 6-Series Multiparameter User Manual
Page 231
EcoWatch for Windows
Section 4
YSI Incorporated
Environmental Monitoring Systems Manual
4-35
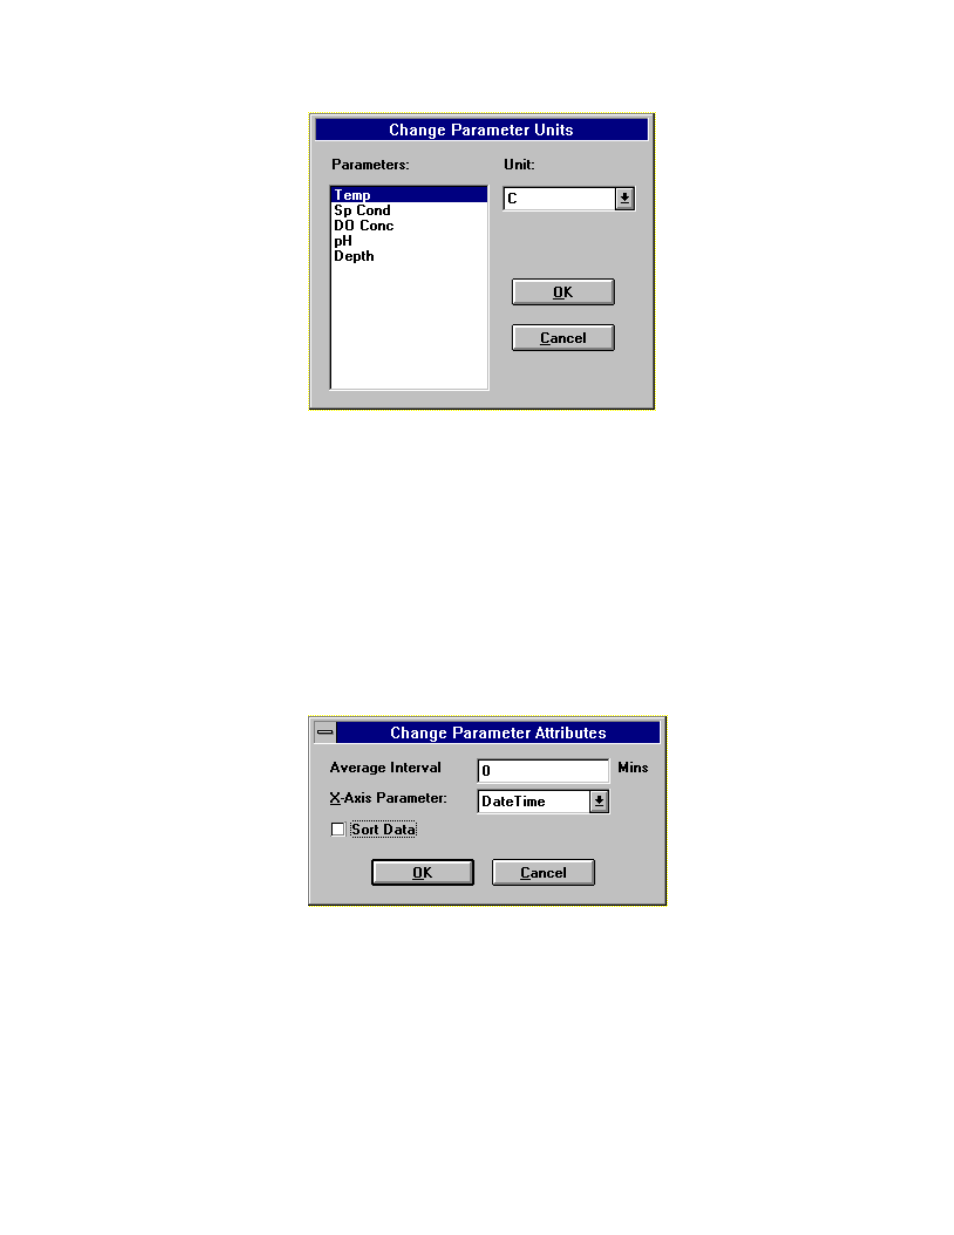
Attributes
This command takes you to the Change Parameter Attributes dialog box where you have access
to two powerful features. You can choose to display an average of your data, or graph the data
with some parameter other than time for the x-axis. The most common use for this latter feature is
to graph temperature and DO versus depth. Other combinations are possible. You may choose to
average the data before it is graphed. An interval of 0 will cause there to be no averaging at all.
The larger the averaging interval, the more points will be used in each average. For example, if
you acquired data every 15 minutes and you set the average interval to 60 minutes, each set of four
points will be averaged and then plotted as a single point. This feature will not only smooth a
graph, but will also reduce the amount of data exported that is sometimes convenient when
exporting to a spreadsheet.
The x-axis parameter is normally Time, but you can choose any parameter you like. By default,
data files are sorted by increasing time. If you have chosen another parameter for the x-axis, then
you may want to have the data sorted before graphing it.
Change name
This command takes you to the Define Parameter Name dialog box where you may change the
default names of the parameters.
This dialog is intended to make changes like "degrees Celsius" to "degrees C". If you change
"degrees Celsius" to "degrees Fahrenheit", then the data displayed will be in degrees Celsius even
though the graph says "degrees Fahrenheit." To change the units for that parameter, use the
Change Parameter Units dialog box.