Bell & Gossett S14333 Technologic 5500 Series ZoneSav Controller User Manual
Page 23
23
4.7.1
Averages
From the Log Selection screen, shown in section 4.7,
press 1 and ENTER to get to the Averages screen
shown below.
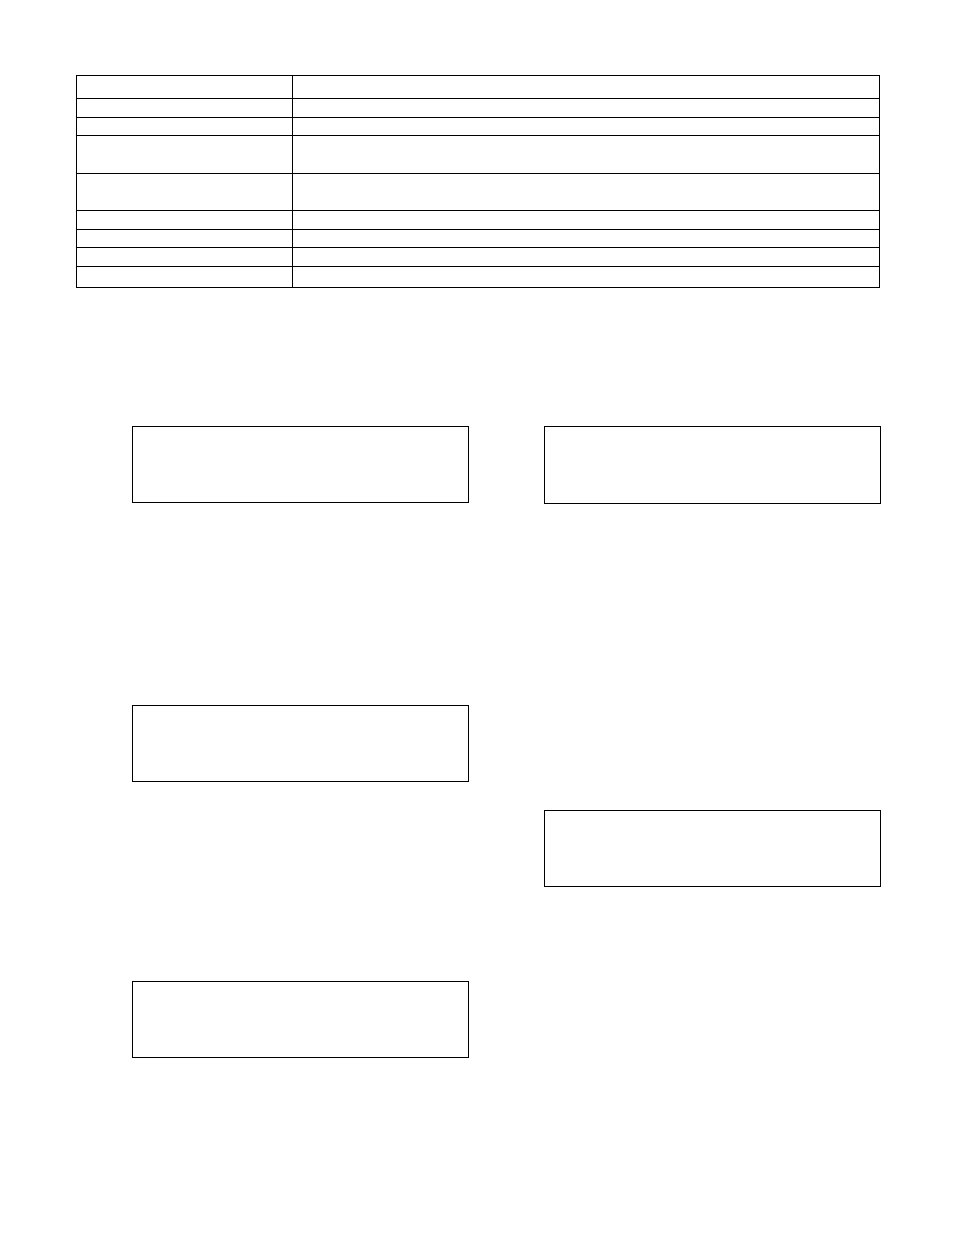
Avg TON = #####
Avg MBH = ############
Avg GPM = #####
Press Clear to Exit
The average heat transfer rate and flow rate are
shown here. 1 MBH = 1000 btu/hr. 1 TON = 12
MBH. These values are only calculated while system
is started and in auto operation mode. They can be
reset from the setup menu. See section 0.
4.7.2
Totals
From the Log Selection screen, shown in section 4.7,
press 2 and ENTER to get to the Totals screen shown
below.
Tot Gal = #####
Tot KBTU = ############
Press Clear to Exit
The total number of gallons and BTUs are shown
here. 1KBTU = 1000 btu. These values are only cal-
culated while system is started and in auto operation
mode. They can be reset from the setup menu. See
section 0.
4.7.3
Alarm Log
From the Log Selection screen, shown in section 4.7,
press 3 and ENTER to get to the Alarm Log screen
shown below.
DATE
TIME
ALARM
MMDD
HHMM
ALARM
"
"
"
"
The four digit date is displayed in the MMDD format.
The four digit time is displayed in the 24 hour HHMM
format. Press NEXT SCREEN or PREV. SCREEN to
view more events. The most recent alarm is shown
first. Press the CLEAR key to exit this screen.
4.7.4
Valve Log
From the Log Selection screen, shown in section 4.7,
press 4 and ENTER to get to the Valve Log screen
shown below.
Rate: (Valve Log Rate)
DATE
Maximum = ###%
TIME
Minimum = ###%
Average = ###%
Scrn# 1
The four digit date is displayed in the MMDD format.
The four digit time is displayed in the 24 hour HHMM
format. The current logging interval is shown. See
section 3.2.2 to change the log rate. The maximum
and minimum valve positions that were observed
during the specified logging interval will be logged.
The average valve position over the interval is also
shown.
Press NEXT SCREEN or PREV. SCREEN to view
more events. The most recent event is shown first.
Press the CLEAR key to exit this screen.
4.7.5
Data Log
From the Log Selection screen, shown in section 4.7,
press 5 and ENTER to get to the Data Log screen
shown below.
(Sensor Type)
Max = #####
DATE
Min = #####
TIME
Avg = #####
Scrn#
The Data Log screen will show the minimum and
maximum values for the system supply temperature,
zone supply temperature, zone return temperature,
and flow. It will save the sixty most recent entries.
The type is shown in the upper left corner. Pressing
the UP ARROW and DOWN ARROW will change the
sensor type.
The four digit date is displayed in the MMDD format.
The four digit time is displayed in the 24 hour HHMM
format. The maximum and minimum values that
were observed during the specified logging interval
will be logged. The average sensor value over the
interval is also shown. See section 3.1.2 to change
the log rate.
Warning Message
Detailed Description
2.5mA < AI # < 3.9mA
The specified AI # is greater than 2.5mA but less than 3.9mA
AI # > 19.8mA
The specified analog input is greater than 19.8mA
Unusual Temps (COOL)
The zone supply temperature is less than the system supply temperature, or the zone
return temperature is less than the zone supply temperature
Unusual Temps (HEAT)
The zone supply temperature is greater than the system supply temperature, or the zone
return temperature is greater than the zone supply temperature
System Temp Limit
The controller is in System Temperature Limit operation
Flow Limit
The controller is in Flow Limit operation mode
Zone Supply SP Index
The controller is in zone supply setpoint indexing mode
Zone Return SP Index
The controller is in zone return setpoint indexing mode
Table 33: Warning Messages