2 packet statistics, Figure 114 packet statistics, Table 40 packet statistics – ZyXEL Communications V300 User Manual
Page 97: 97 8.2 packet statistics
Chapter 8 Status Screens
V300 User’s Guide
97
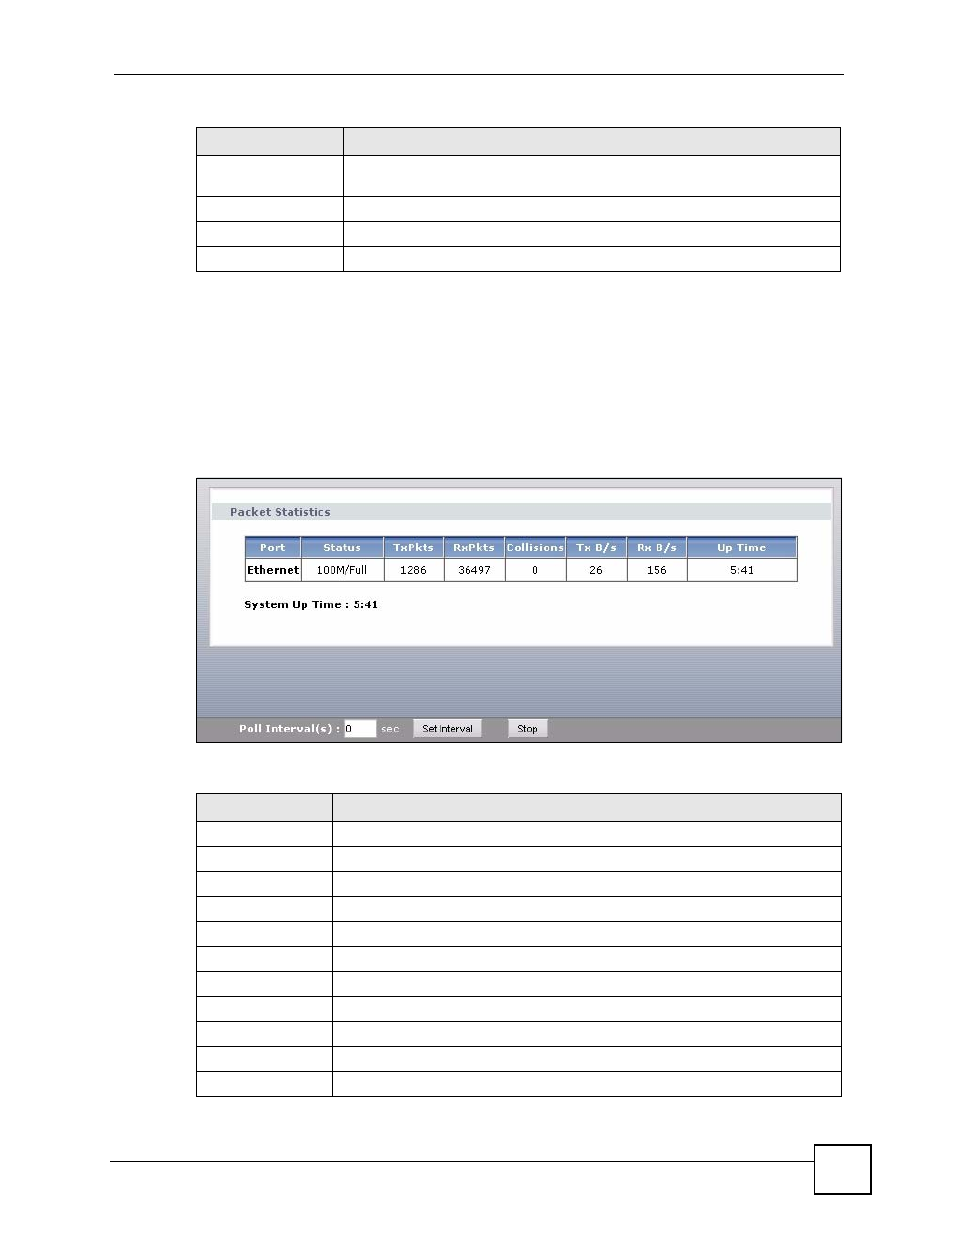
8.2 Packet Statistics
To access this screen, open the Status screen (see
(Details...) next to Packet Statistics. Read-only information here includes port status and
packet specific statistics. Also provided are "system up time" and "poll interval(s)". The Poll
Interval(s) field is configurable.
Figure 114 Packet Statistics
The following table describes the fields in this screen.
URI
This field displays the account number and service domain of the SIP account.
You can change these in VoIP > SIP > SIP Settings.
Summary
VoIP Statistics
Click this link to view statistics about your VoIP usage.
Packet Statistics
Click this link to view port status and packet specific statistics.
Table 39 Status Screen
LABEL
DESCRIPTION
Table 40 Packet Statistics
LABEL
DESCRIPTION
Packet Statistics
Port
This column displays each interface of the V300.
Status
This displays the port speed and duplex setting.
TxPkts
This field displays the number of packets transmitted on this interface.
RxPkts
This field displays the number of packets received on this interface.
Collisions
This field displays the number of collisions on this port.
Tx B/s
This field displays the number of bytes transmitted in the last second.
Rx B/s
This field displays the number of bytes received in the last second.
Up Time
This field displays the elapsed time this interface has been connected.
System up Time This is the elapsed time the system has been on.
Poll Interval(s)
Type the time interval (in seconds) for the browser to refresh system statistics.