Displaying the polar equation editor, Setting the graph screen window variables – Texas Instruments TI-86 User Manual
Page 130
118
Chapter 8: Polar Graphing
08POL.DOC TI-86, Chap 8, US English Bob Fedorisko Revised: 02/13/01 2:26 PM Printed: 02/13/01 3:02 PM Page 118 of 8
08POL.DOC TI-86, Chap 8, US English Bob Fedorisko Revised: 02/13/01 2:26 PM Printed: 02/13/01 3:02 PM Page 118 of 8
08POL.DOC TI-86, Chap 8, US English Bob Fedorisko Revised: 02/13/01 2:26 PM Printed: 02/13/01 3:02 PM Page 118 of 8
Displaying the Polar Equation Editor
To display the polar equation editor, select
r(
q
)=
from the
GRAPH
menu in
Pol
graphing mode
(6 &). The polar equation editor menu displayed on the bottom line is the same as the
Func
mode equation editor menu, except that
q
and
r
replace
x
and
y
.
In this editor, you can enter and display up to 99 polar
equations,
r1
through
r99
, if sufficient memory is available.
Equations are defined in terms of the independent variable
q
.
The default graph style is » (line) in
Pol
graphing mode.
¾ (shade above) and ¿ (shade below) graph styles are not
available in
Pol
graphing mode.
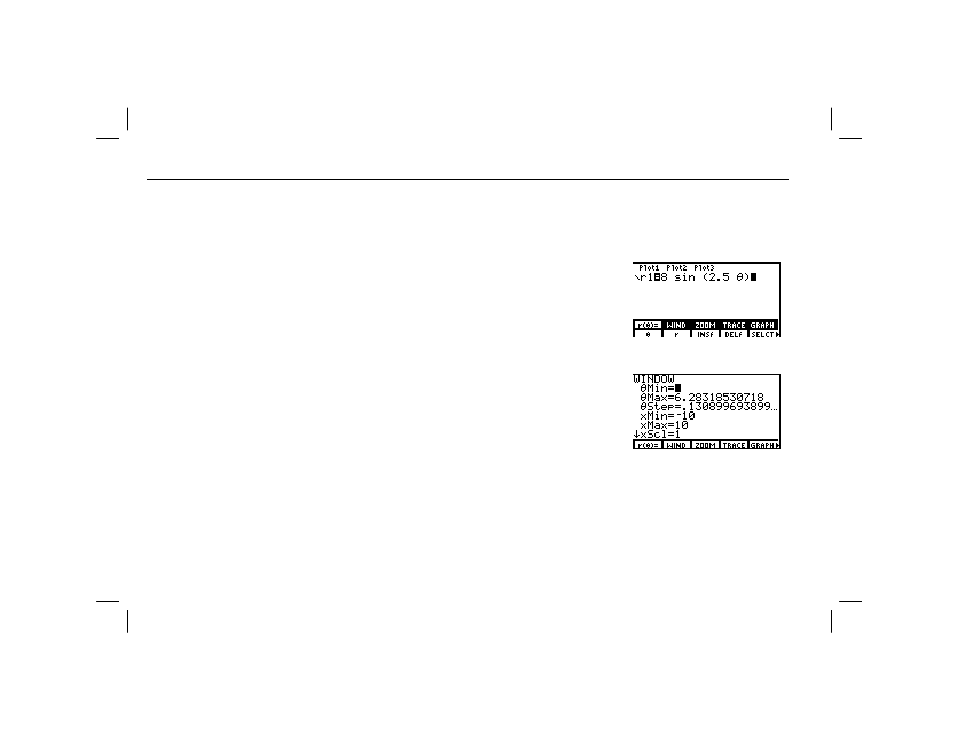
Setting the Graph Screen Window Variables
To display the polar window editor, select
WIND
from the
GRAPH
menu (6 ').
Pol
graphing mode has the same
window variables as
Func
graphing mode, except:
♦
xRes
is not available in
Pol
graphing mode.
♦
q
Min
,
q
Max
, and
q
Step
are available in
Pol
graphing mode.
The values shown in the picture to the right are the
defaults in
Radian
mode.
$
indicates that
yMin=
L
10
,
yMax=10
, and
yScl=1
are beyond the screen.
q
Min=0
Specifies the first
q value to evaluate within the graph screen
q
Max=6.28318530718
Specifies the last
q value to evaluate within the graph screen
q
Step=.13089969389957
Specifies the increment from one
q value to the next q value
q
Max
default is 2
p
.
q
Step
default is
pа
24.