Inferential stat editors, Displaying the inferential stat editors – Texas Instruments TI-84 User Manual
Page 338
Chapter 13: Inferential Statistics and Distributions
335
Inferential Stat Editors
Inferential Stat Editors
Inferential Stat Editors
Inferential Stat Editors
Displaying the Inferential Stat Editors
Displaying the Inferential Stat Editors
Displaying the Inferential Stat Editors
Displaying the Inferential Stat Editors
When you select a hypothesis test or confidence interval instruction from the home
screen, the appropriate inferential statistics editor is displayed. The editors vary
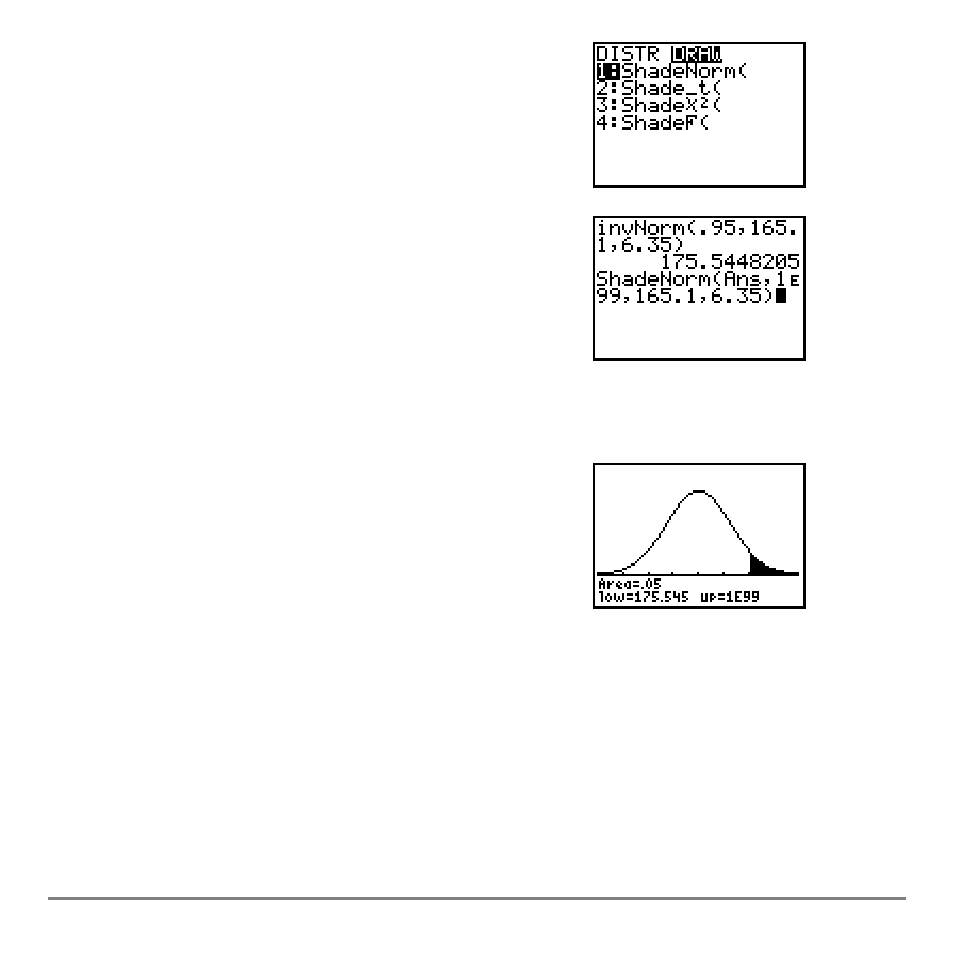
13. Press
y = ~ to display the
DISTR DRAW
menu.
14. Press
Í to paste
ShadeNorm(
to the home
screen.
Press
y Z ¢
1
y D
99
¢
165
Л
1
¢
6
Л
35
¤.
Ans
(175.5448205 from step 11) is the lower
bound. 1
â99 is the upper bound. The normal curve
is defined by a mean
m of 165.1 and a standard
deviation
s of 6.35.
15. Press
Í to plot and shade the normal curve.
Area
is the area above the 95th percentile.
low
is
the lower bound.
up
is the upper bound.