Scatter, Xyline – Texas Instruments TI-84 User Manual
Page 322
Chapter 12: Statistics
319
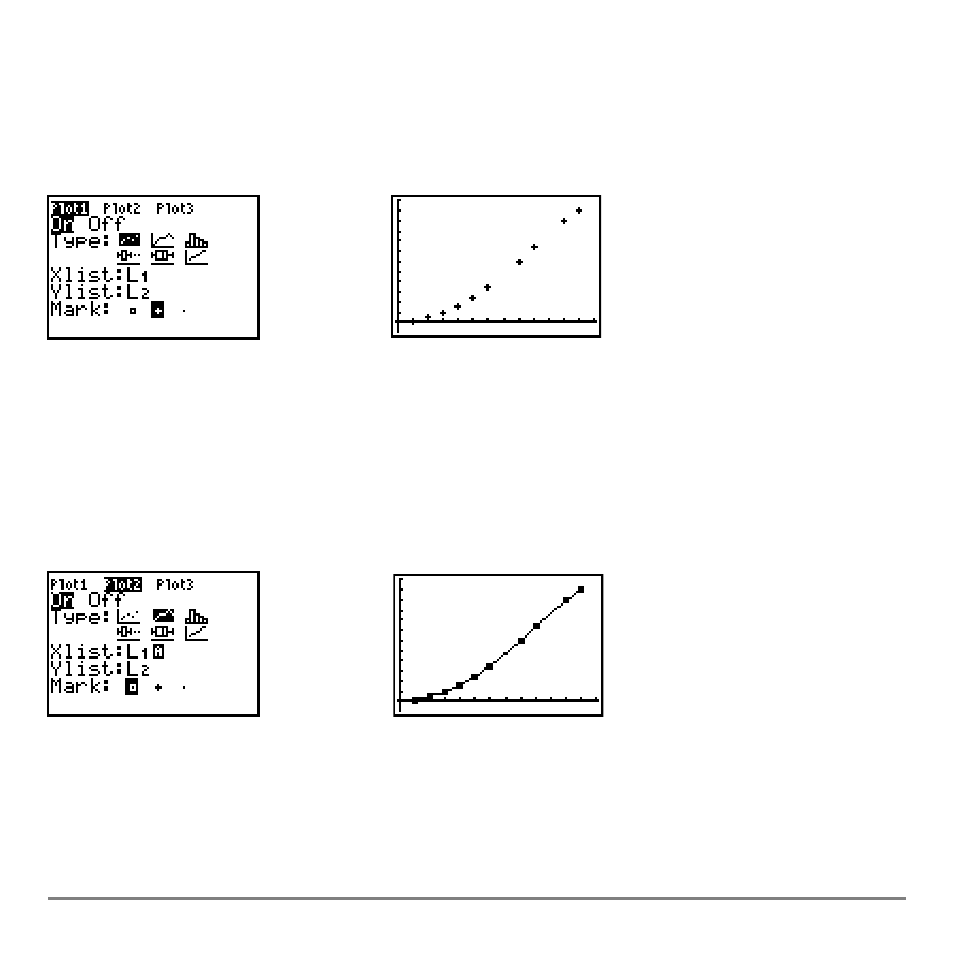
Scatter
Scatter
Scatter
Scatter
Scatter
(
")plots plot the data points from
Xlist
and
Ylist
as coordinate pairs, showing
each point as a box (
› ), cross (
+
), or dot (
¦ ).
Xlist
and
Ylist
must be the same length.
You can use the same list for
Xlist
and
Ylist
.
xyLine
xyLine
xyLine
xyLine
xyLine
(
Ó)is a scatter plot in which the data points are plotted and connected in order
of appearance in
Xlist
and
Ylist
. You may want to use
SortA(
or
SortD(
to sort the lists
before you plot them.