Texas Instruments TI-84 User Manual
Page 283
Chapter 12: Statistics
280
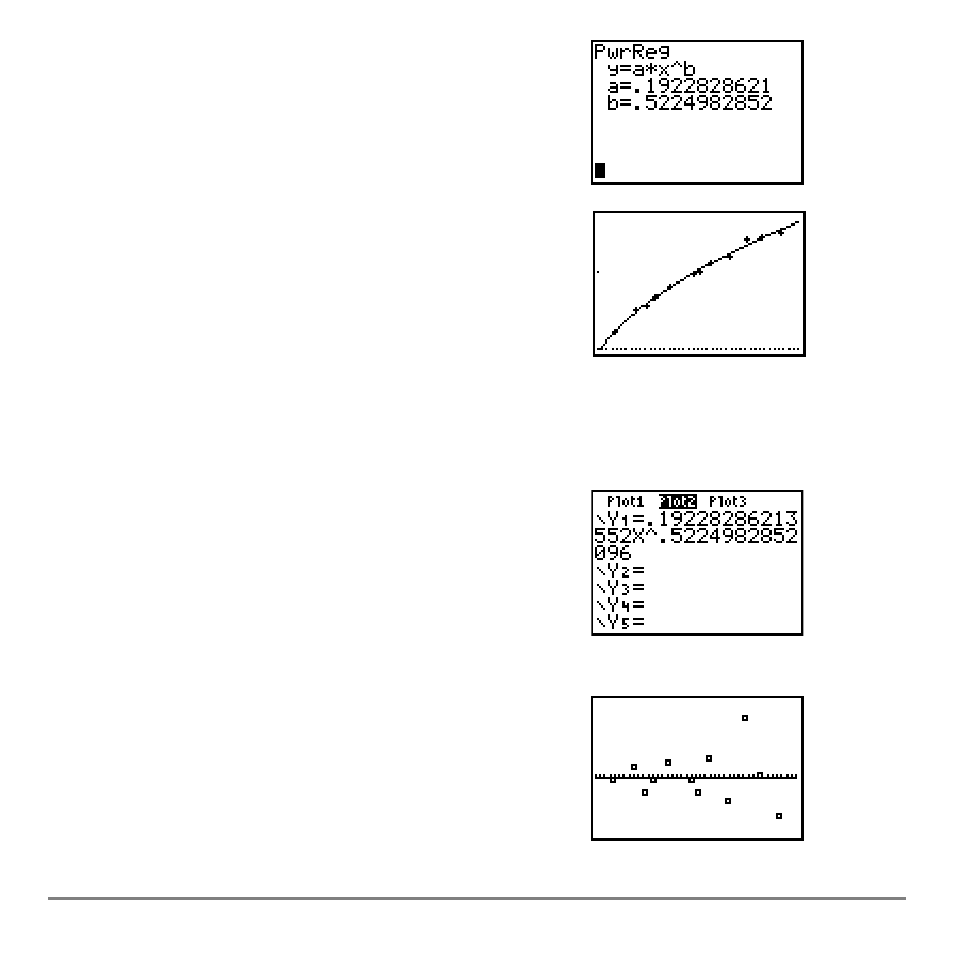
The new function y=.192x
.522
appears to fit the data well. To get more information,
examine a residual plot.
25. Press
Í to calculate the power regression.
Values for
a
and
b
are displayed on the home
screen. The power regression equation is stored
in
Y1
. Residuals are calculated and stored
automatically in the list name
RESID
.
26. Press
s. The regression line and the scatter
plot are displayed.
27. Press
o to display the Y= editor.
Press
| Í to deselect
Y1
.
Press
} Í to turn off plot 1. Press ~ Í to
turn on plot 2.
Note:
Step 19 defined plot 2 to plot residuals
(
RESID
) versus string length (
L1
).
28. Press
q
9
to select
9:ZoomStat
from the
ZOOM
menu. The window variables are adjusted
automatically, and plot 2 is displayed. This is a
scatter plot of the residuals.