Defining and displaying polar graphs, Ti-84 plus graphing mode similarities – Texas Instruments TI-84 User Manual
Page 148
Chapter 5: Polar Graphing
145
Defining and Displaying Polar Graphs
Defining and Displaying Polar Graphs
Defining and Displaying Polar Graphs
Defining and Displaying Polar Graphs
TI-84 Plus Graphing Mode Similarities
TI-84 Plus Graphing Mode Similarities
TI-84 Plus Graphing Mode Similarities
TI-84 Plus Graphing Mode Similarities
The steps for defining a polar graph are similar to the steps for defining a function graph.
Chapter 5 assumes that you are familiar with Chapter 3: Function Graphing. Chapter 5
details aspects of polar graphing that differ from function graphing.
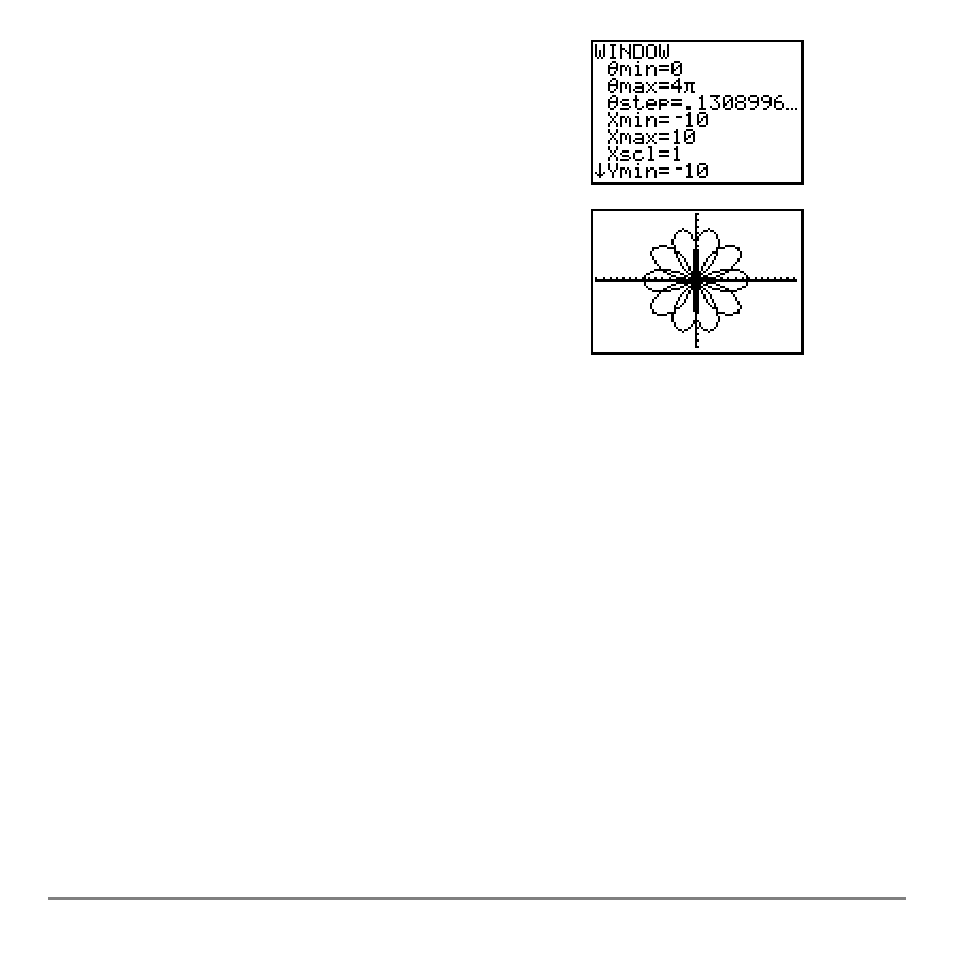
4.
Press
p to display the window variables.
Press
†
4
y B
to increase the value of
q
max
to
4
p.
5.
Press
q
5
to select
5:ZSquare
and plot the
graph.
6.
Repeat steps 2 through 5 with new values for the
variables
A
and
B
in the polar equation
r1=Asin(B
q
)
. Observe how the new values affect
the graph.