Yaskawa DriveWizard AC Drive User Manual
Page 108
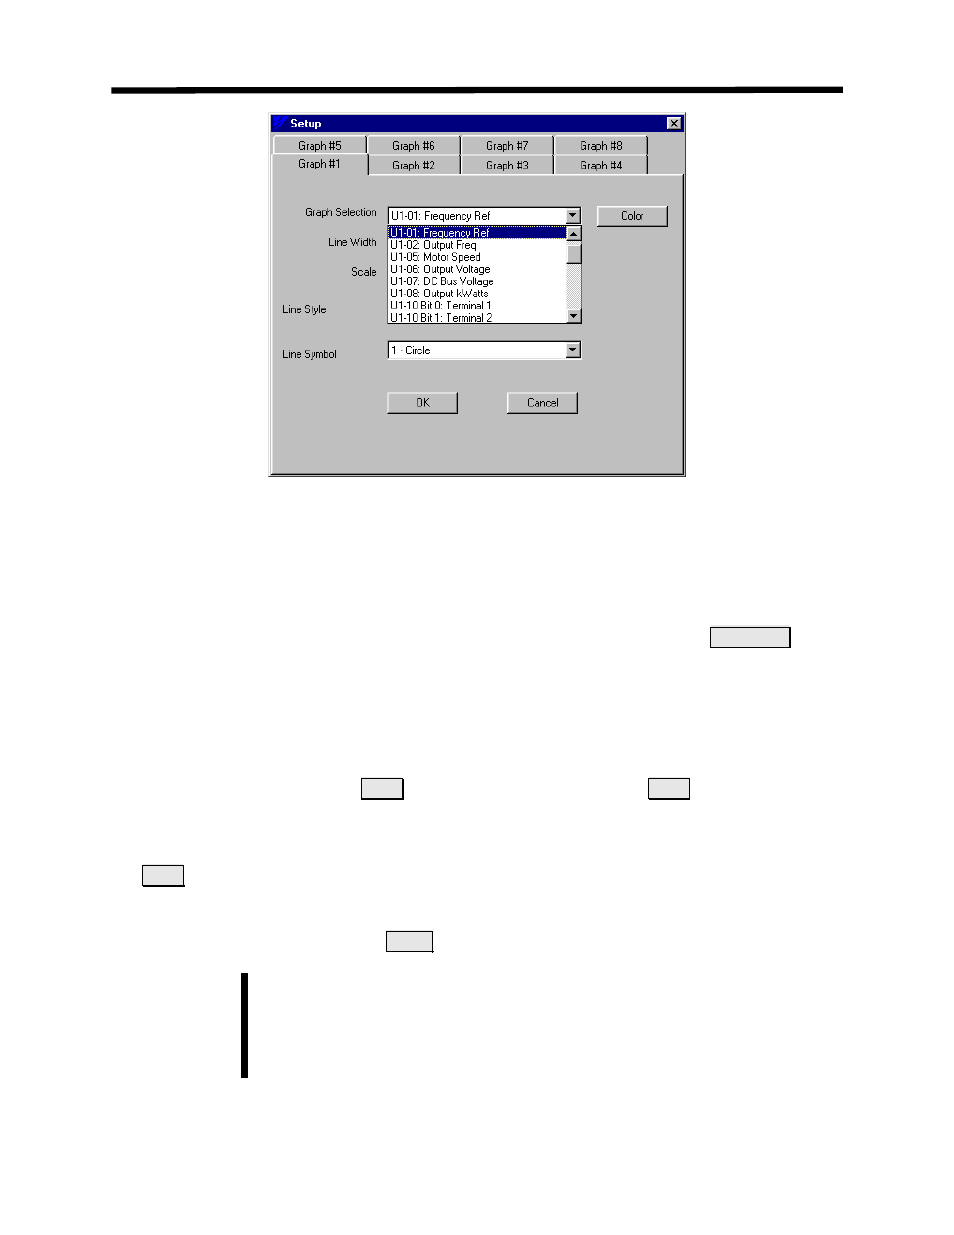
Figure 7.4: Selection of Graph Monitor Selection
5. You selections should now be listed below the graph spreadsheet (see Figure 7.5). If they are
not, go back into the setup section and check your settings.
6. If you wish, the sample rate or time per data point can be set to a different value other than
the default of 1 second. Go to the graph properties by clicking on the graph
Properties
button. Select the desired sample time. (refe to Graph Properties later in this chapter).
7. Once the items to be graphed have been chosen, it may be beneficial to put a title on the
graph, change the background color, or change the grid’s appearance using the Properties
Button.
mation.
r
Refer to the Graph Properties Button later in this chapter for more infor
8. To begin graphing, press the
S
ge to a
Stop
button. The
tart
button. It will then chan
computer will start graphing the item(s) listed below the graph.
9. When you have obtained the data needed or wish to graph different parameters, push the
Stop
button to stop the computer from graphing. At this point, the graph may be examined
using the zoom arrows, printed and/or saved to a file for later use.
10. To begin a new graph, press the
Clear
button.
DriveWizard
™ will save the graph setup when going off-line from the drive.
The settings will be saved per drive type (i.e. G5, V7, F7, etc.)
Note!
Using the Graphing Function
108