Selcal analysis – Wavecom W61PC V7.5.0 User Manual
Page 102

92
Analysis Tools
WAVECOM Decoder W61PC/LAN Manual V7.5
Several color schemes are available through the right-click menu.
By clicking on the displays graphic cursors may be used to move over the graph to allow measurement of
data.
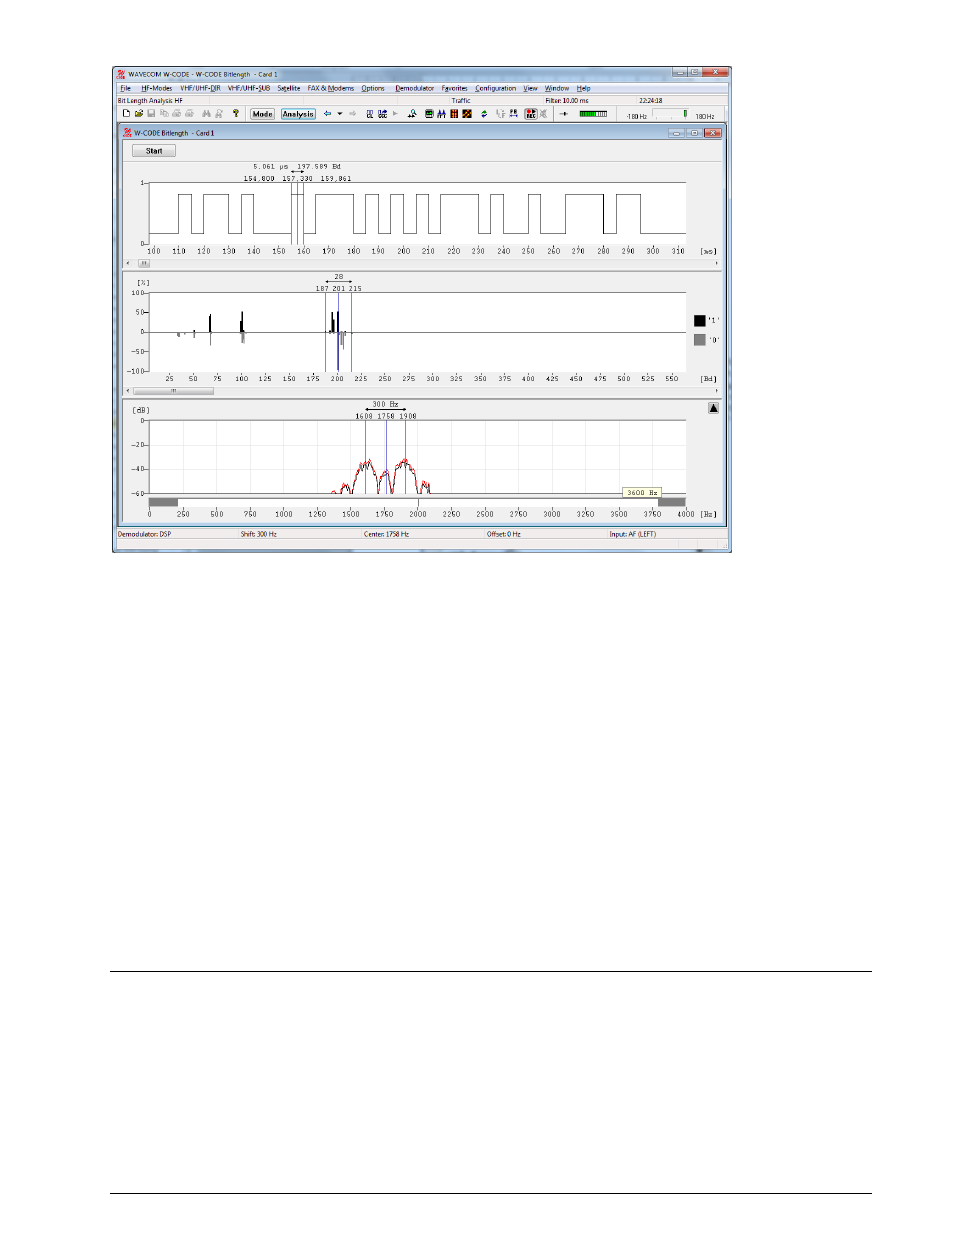
The bottom window shows the distribution of bit lengths, as computed from the sampled data.
It should be noted that reception in the HF band may be subject to distortions. In such cases the distribu-
tions for the "0" and "1" values should be averaged.
In the top window a graphical representation of the binary data "0" and "1" is provided. The resolution
may be set using the zoom function. Practical values are between 1000 s and 10000 s. In general, the
resolution is controlled by the smallest parameter to be measured. For MFSK, this corresponds to tone
changes and RTTY to data transitions (bits).
Using the scroll bar the binary bit pattern may be continuously moved left or right. This allows easy loca-
tion of the bit/tone duration to be measured.
The example shows the lower section of the screen display after using the zoom function. The cursors may
be moved across the bit pattern. The individual positions of the cursors, as well as the difference between
the two cursors, are continuously displayed in s and Bd.
When measuring binary 0s or 1s (mark or space) it should be noted that the two levels may be subject to
severe distortions, depending on the quality of the received signal. Using the average value over a number
of measurements improves the accuracy of results. Some transmission modes are modulated in terms of
bit length or bit position (Pulse Width and Pulse Position Modulation).
SELCAL ANALYSIS
The SELCAL analysis for the VHF/UHF range employs a graphical display in two dimensions, frequency (y-
axis) and time (x-axis). Both values may be preset. This tool was developed for the analysis of analogue
sequential single tone call systems.
After starting SELCAL Analysis the detected frequency values are displayed as pixels.
A SELCAL signal is easily recognized as stable lines. To stop the horizontally scrolling display, click on the
display. Measurement cursors for both the time axis and the frequency axis appear. The display may be
scrolled backwards, with a maximum range of 15 seconds when tracking rate is set to 1 ms, and 225 sec-
