Super Systems SDS 8120 User Manual
Page 59
Super Systems Inc.
Page 59 of 104
Color Touch Screen Data Logger Operations Manual
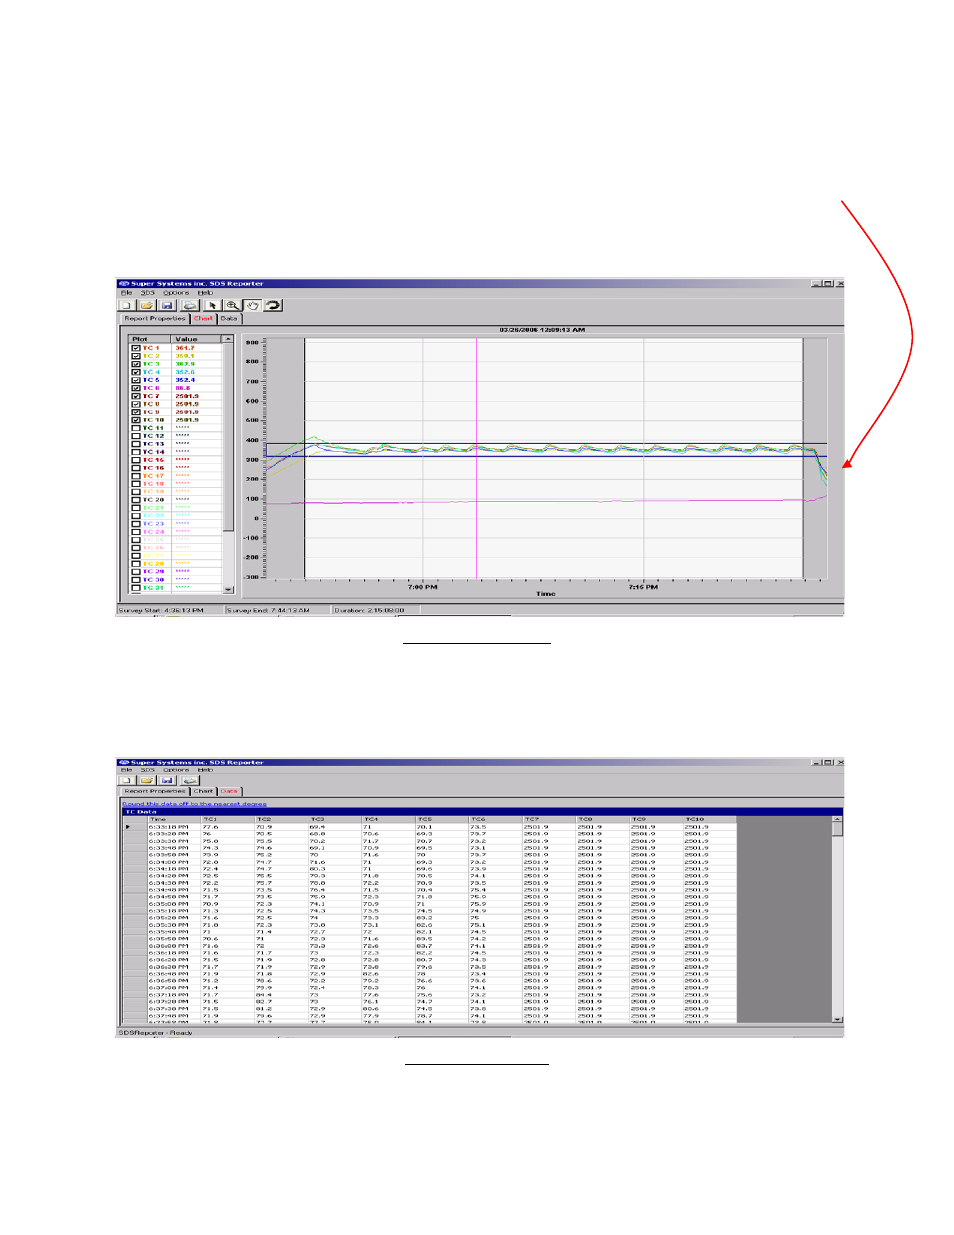
The Chart Tab (Figure 77) contains the charted information from the time specified on the
survey. This tab is similar in design and function to the Real-Time chart (Figure 89). When the
chart tab is active, the chart toolbar buttons also appear and these buttons can be used to zoom
in on a section of the chart, pan the chart up, down, left or right, and refresh the chart back to
its original values. The screen will display 2 horizontal lines that represent the high and low
temperature tolerance levels based on the setpoint. This display will change based on the
tolerance level and setpoint defined in the Report Parameters. For more information about the
function of this screen, see the section “SDS View Real-time Data.”
Figure 77 - Chart Tab
Note: checking or unchecking TCs on the Chart Tab will affect the Active TCs on the Report
Properties – Thermocouples tab.
The Data Tab (Figure 78) contains the data from each thermocouple for the each interval
selected from the Load Survey Data screen (Figure 59).
Figure 78 - Data Tab
Clicking on the “Round this data off to the nearest degree” link will pop up a message box
confirming the action (Figure 79). The rounding only affects imported data. The data in the