N figure, Figure 120 – Daktronics Venus DataStreamer User Manual
Page 70
64
Creating Messages for the Panelized DataTrac
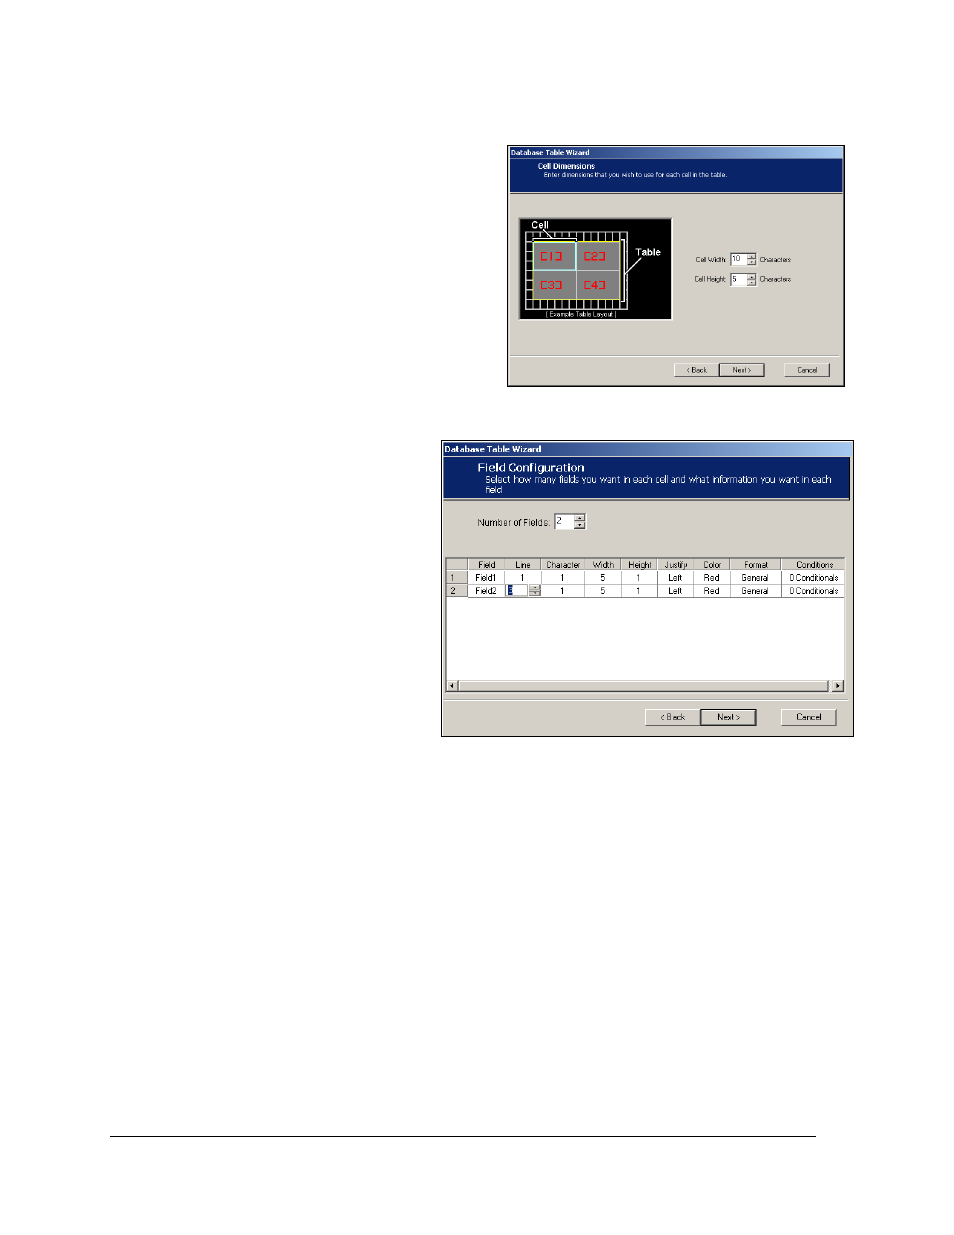
8. Click in the Width column to set the maximum number of characters available for the
field to be displayed.
9. Click in the Height field to set the
number of rows that will be used to
display the information.
Note: If a field is wider than the
allowed width, set the height higher
than one and the data will wrap onto
the additional rows.
10. Click in the Justify and Color columns
to set the appearance of the data in the
field.
11. Click in the Format column
to set any necessary
parameters for the field.
12. The Conditions field allows
data to be monitored and
values to be modified
according to certain criteria.
Refer to Section 8 for
information on setting
conditionals. Click Next.
13. To Show Only Specific
Results, click that radio
button as shown in Figure
121. Then click the up and
down arrows next to the
Starting Result and Number of
Results fields, selecting the result on which the table will start and the number of
results to be shown.
OR
Click the Page Results portion of the screen and set the Paging Interval for reports
with several results to rotate through the display. The Page Results option allows all
the results for a query to be displayed.
Figure 119: Setting Cell Dimensions
Figure 120: Setting Field Configurations