Entering a financial table – Daktronics Venus DataStreamer User Manual
Page 59
Creating Messages for the Panelized DataTrac
53
3. Click the down arrow next to Select a Field to set the query information. This function
allows the selection of data to be displayed for a stock index. For example, today’s
high, low, last price, or the change of a
stock price may be selected.
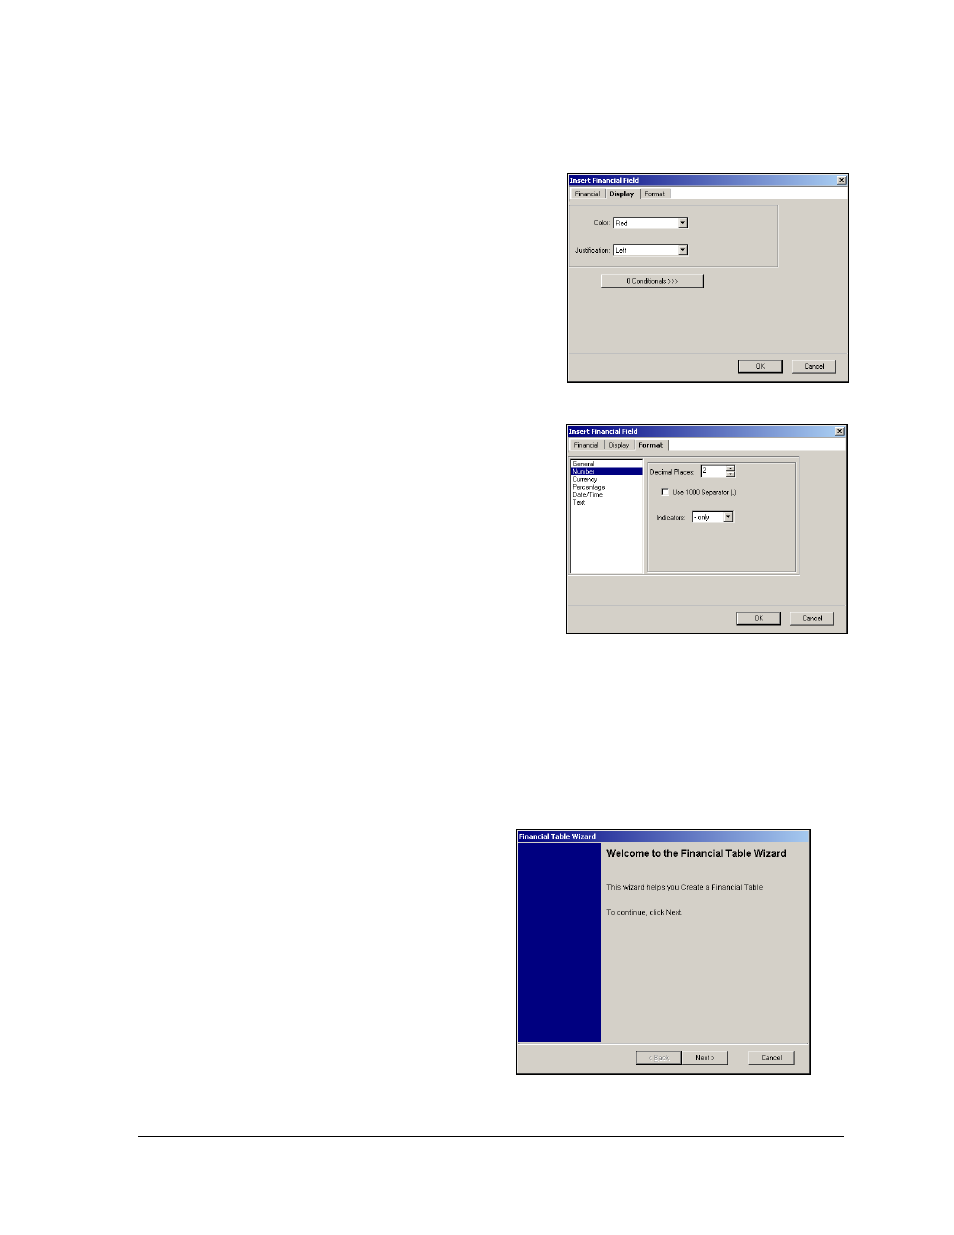
4. Click the Display tab to set the color and
alignment of the financial information as
shown in Figure 91. Refer to Section 8 for
information on setting conditionals.
5. Click the Format tab to set the parameters
of the information as shown in Figure 92.
For example, if the data will be displayed
in numerical form, the number of decimal
places can be set here.
6. From the File pull-down menu, click Save
to save the message and information. The
message is now ready to be sent to the
display.
7. Repeat the above steps as necessary to
create and place all desired fields.
Entering a Financial Table
Occasions may arise when it is necessary to know
which stocks are performing in a specific manner,
for example, which stocks are most active. The Financial Table Wizard allows the user to select
a financial exchange, such as the NYSE, and set the criteria for monitoring that exchange.
To create a Financial Table, complete the following steps:
1. Open a new DataTrac window in the Venus DataStreamer software.
2. Right-click within the new message
window and a pop-up menu will
appear. Click New and Financial
Table. The Financial Table Wizard
will appear as shown in Figure 93.
3. Click Next.
4. Click the down arrow next to the
Query field and select the desired
query information as shown in
Figure 91: Financial Display Tab
Figure 92: Financial Format Tab
Figure 93: Financial Table Wizard