Using data fits to obtain dispersion – EXFO FastReporter 2 User Manual
Page 368
Measuring Chromatic Dispersion: Theory
358
FastReporter 2
Using Data Fits to Obtain Dispersion
Using Data Fits to Obtain Dispersion
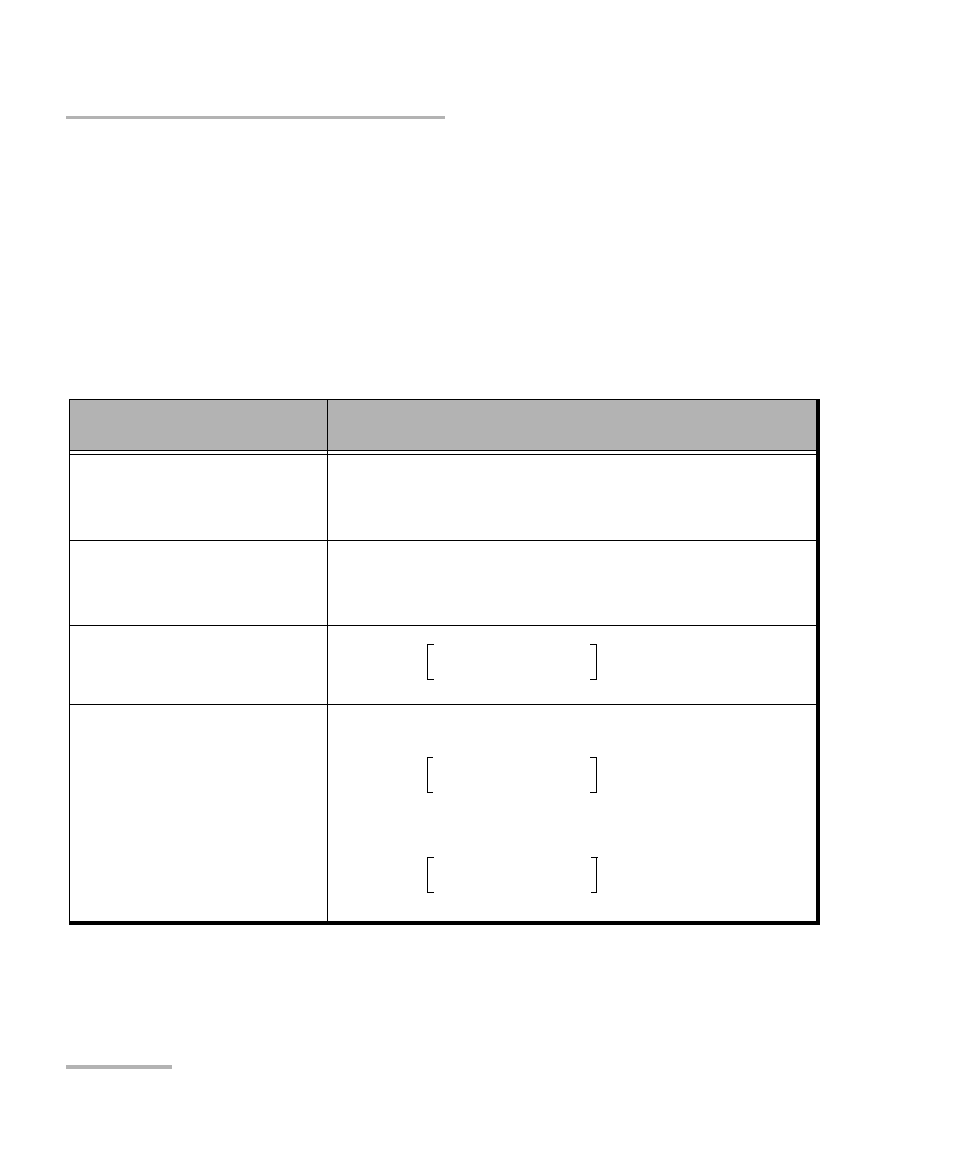
This section gives you details about the way EXFO uses the data fits to
obtain dispersion. Once group delays are computed, equations are fitted in
order to obtain dispersion, dispersion slope and zero-dispersion
wavelengths. The dispersion curve of typical singlemode fibers follows
certain equations used to interpolate zero-dispersion wavelength and
slope. The following table graph shows the equations applied to
singlemode fibers in specific wavelength ranges.
Fiber Type and
Wavelength Range
Expression for D
G.652 NDSF
G.653 DSF
1500 nm-1600 nm
G.655 NZDSF
up to 1560 nm
G.655 NZDSF
1530 nm-1565 nm (C Band)
1565 nm-1625 nm (L Band)
1200 nm
1600 nm
A B
2
C
2
–
+
+
=
D
2 B
C
3
–
–
=
A B
2
C
+
+
=
D
2B
C
+
=
D
D 1560
D 1530
–
30
-------------------------------------------------
1560
–
D 1560
+
=
D
D 1565
D 1530
–
35
-------------------------------------------------
1565
–
D 1565
+
=
D
D 1625
D 1565
–
60
-------------------------------------------------
1625
–
D 1625
+
=