Fip graphic display options – EXFO FastReporter 2 User Manual
Page 214
Working with Fiber Inspection Probe (FIP) files
204
FastReporter 2
FIP Graphic Display Options
FIP Graphic Display Options
The FastReporter 2 application displays the FIP overlay in the graph
window along with the FIP Image. An overlay highlights the inconsistencies
in your FIP with different colors described below.
FAIL Anomaly: the presence of this anomaly implies automatically a
FAIL result.
PASS Anomaly: the presence of this anomaly is not sufficient to confirm
a FAIL, the anomaly count in this case is relevant.
If you select more than one FIP files and enable the appropriate viewing
option, you can have the corresponding graphic displays appear all at once
on-screen. This feature is available for both single fibers and multiple
fibers.
You can also select to see the images according to the cable connector
view. The fibers included in a same cable are grouped, and the cable is
identified in the graph view.
You can copy the FIP images and/or overlays and paste them to the
clipboard. You can also change the display setting of the graph for FIP
measurements so that you can see both the overlay and the graph side by
side.
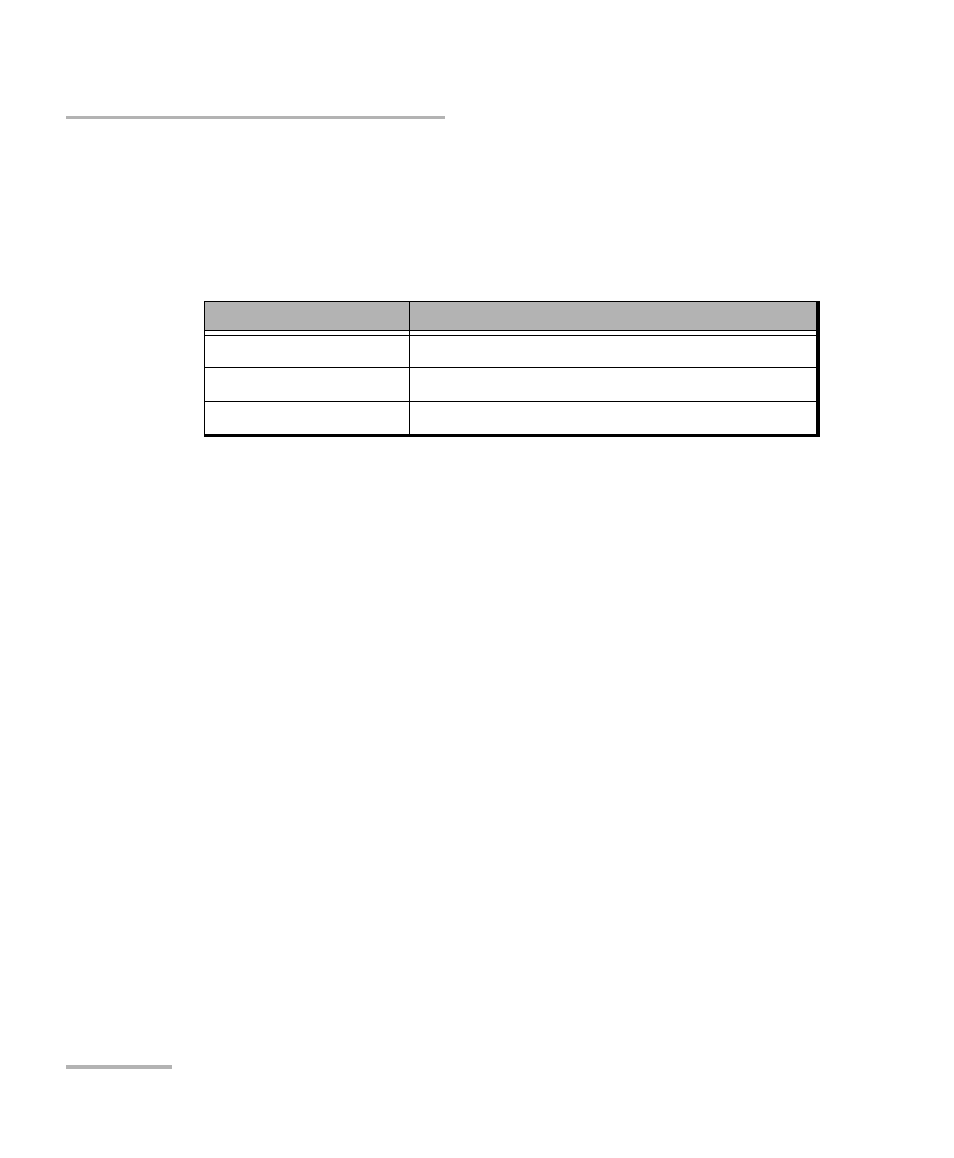
Color Legend
Analysis Anomaly Highlighting
Aqua
PASS Scratch
Green
PASS Defect
Red
FAIL Anomaly