EXFO FastReporter 2 User Manual
Page 305
Generating, Previewing and Printing Reports
Post Processing Software
295
Using Excel Report Templates
Some non-mandatory, or supportive flags, are hidden. One or more can be
added as needed.
Note: The setting name should be written in one block without spaces. They have
been separated on more than one text line in the table below for readability
purposes only.
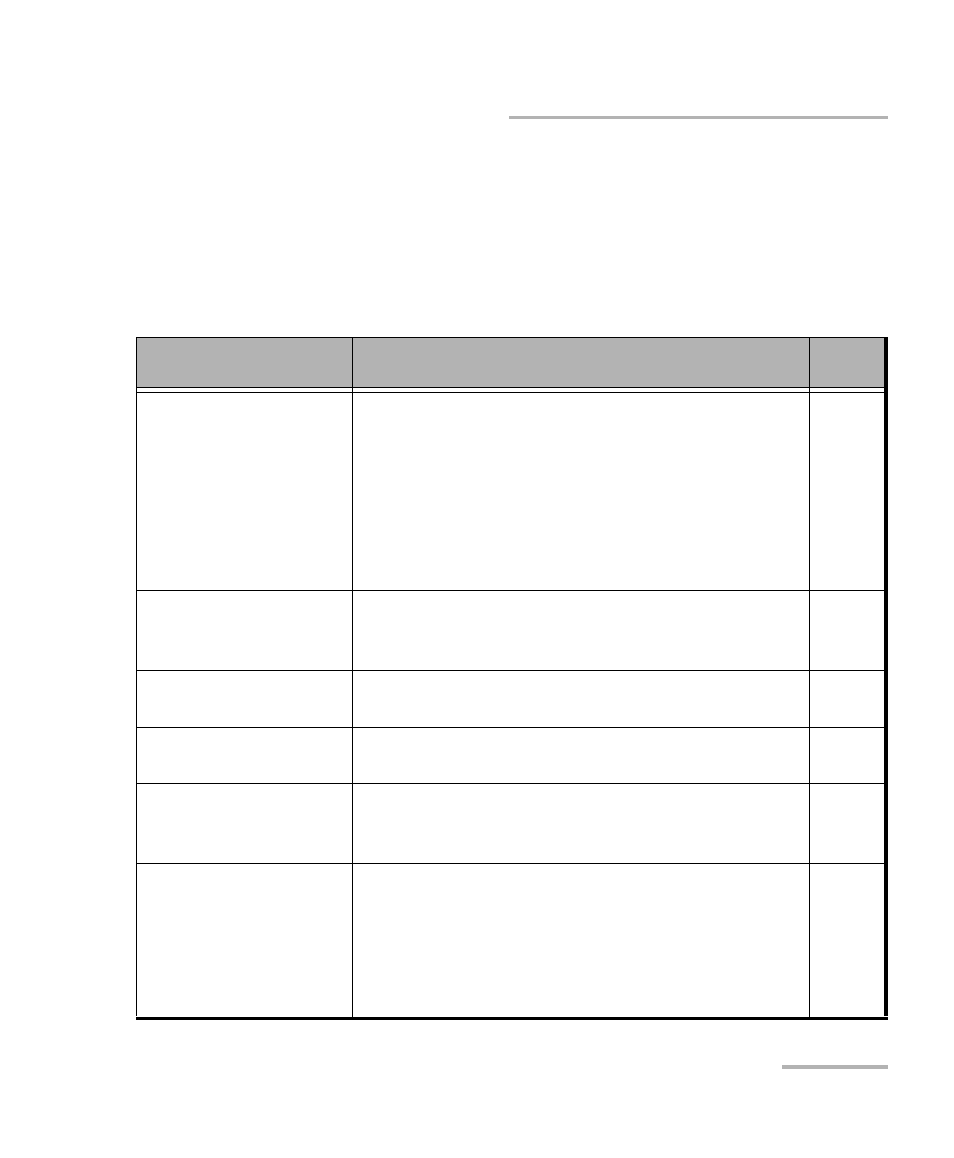
Setting
Purpose
Default
Value
DisplayOnlyMatched
Measurements
To specify if only the data common to both matched
measurements is to be displayed.
For example, if you match two measurements
containing common and different wavelengths
(measurement one has 1310, 1550 and 1625, while
measurement two has 1310, 1410 and 1625), and the
setting is set to true, the report data is displayed for
every distinct wavelength.
FALSE
DisplayGraphPer
Measurement
To specify if a graph should be displayed for each
trace in the measurement, or if all measurements are
to be displayed in a single graph.
FALSE
MeasurementPerSheet
Maximum number of measurements allowed per
sheet. A blank value indicates that there is no limit.
Blank
WavelengthPerSheet
Maximum number of wavelengths allowed per
sheet. A blank value indicates that there is no limit.
Blank
MeasurementTypes
To specify which measurement type should be
supported. A blank value indicates that it supports all
measurement types.
Blank
FillOnlyMatched
Wavelengths
To display data of common wavelengths. Used when
data is coming from different origins and common
wavelengths needs to be displayed.
For example, if your report includes iOLM, OTDR and
FIP files, The iOLM wavelengths are treated first, then
only the OTDR files with matching wavelengths.
FALSE