Figure 4-6 – ADLINK AMP-208C User Manual
Page 88
Motion Control Theory
74
AMP-204C / AMP-208C
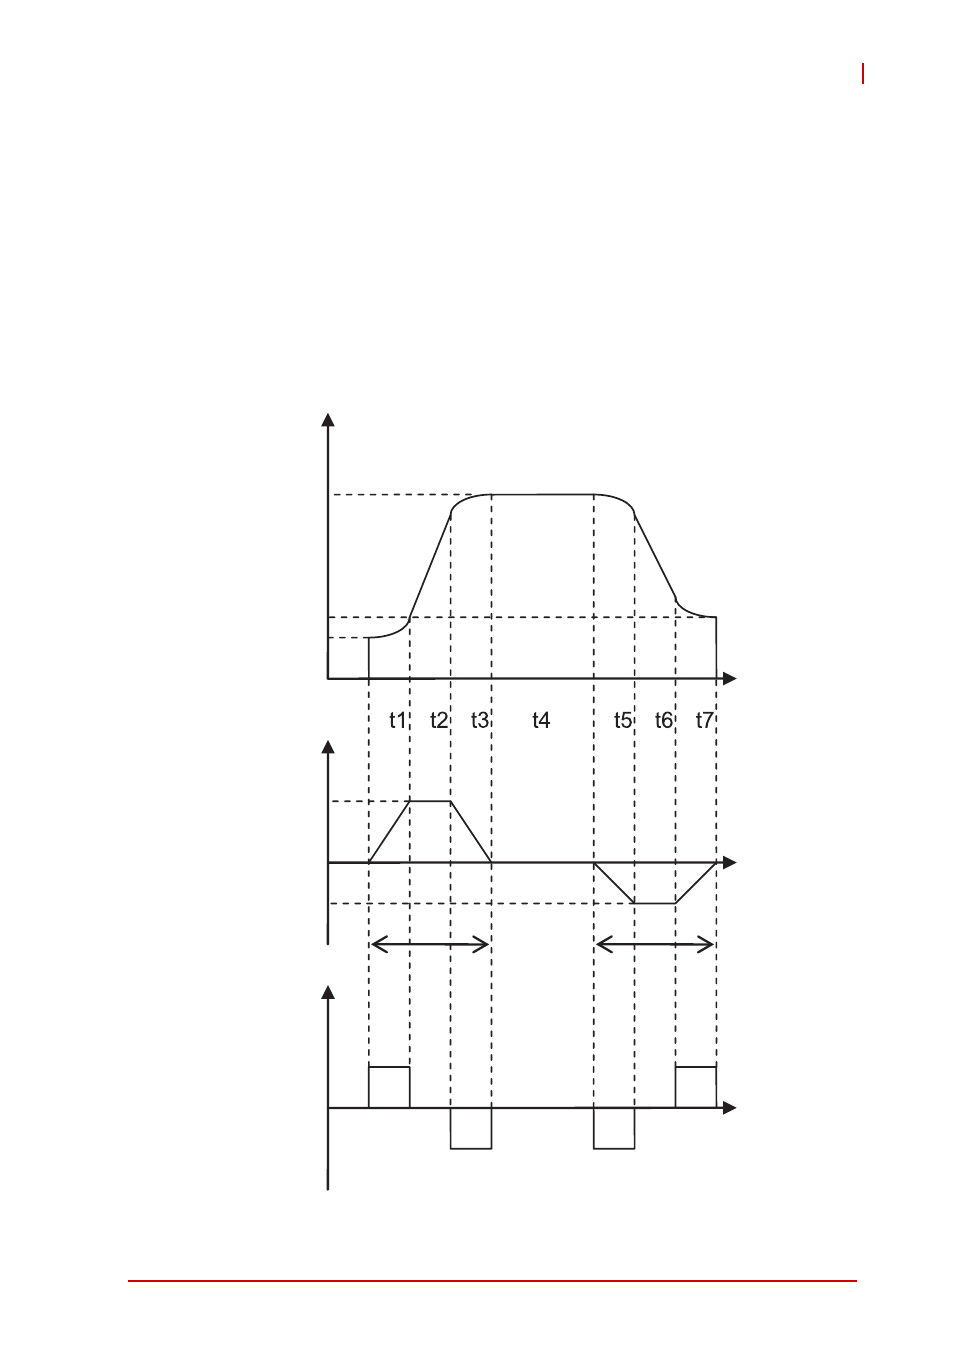
4.2.3.2
S-curve
An S-curve is a curve where the speed profile in the jerk area can
be represented by second-order profile. This helps to reduce
motor vibration at start up and stop time as indicated by points (t1,
t3, t5, t7) in figure below.
To shorten acceleration and deceleration time the linear section
(t2, t6) is inserted in these area to maintain the maximum
accleration and so get an accleration-time (A-T) chart in
trapezoidal.
Figure 4-6: Relation of S-curve speed profile's speed/acceleration/jerk VS
time
Start velocity
End velocity
Max. velocity
Max. acceleration
Max. acceleration
Acc.
Dec.
Distance
Time
Time
Time
Tacc
Tdec
Acceleration
Jerk
Velocity
This manual is related to the following products: