LAARS NeoTherm LC NTV1700 - Install and Operating Manual User Manual
Page 118
LAARS Heating Systems
Page 114
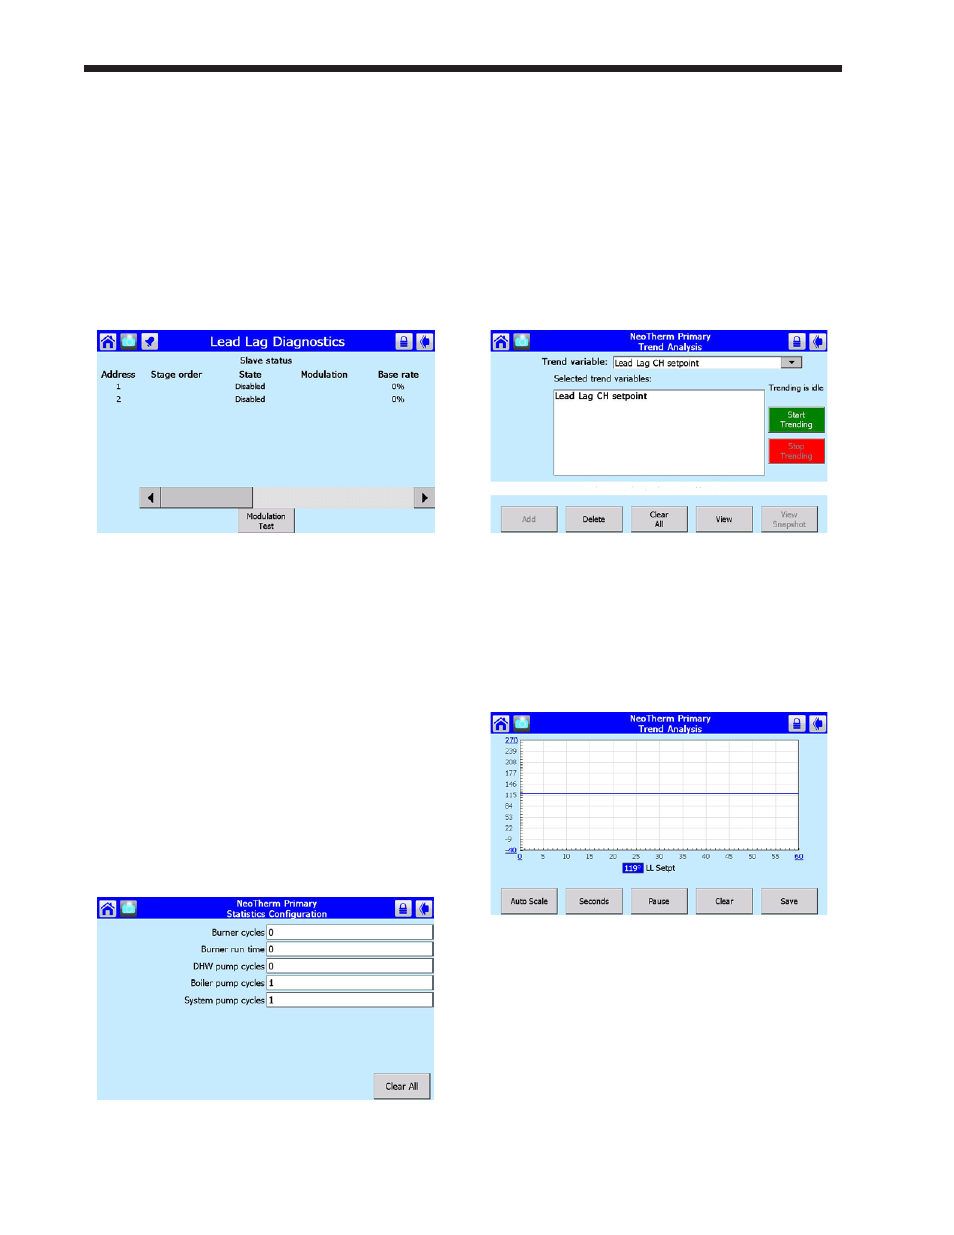
12.5 Lead/Lag Slave Diagnostics
The control system includes a diagnostic screen that
lists some information on the Lead/Lag slaves in the
system. See Fig. 134.
How to get there –
Home Page
Screen
Fig. 134 - Lead/Lag Diagnostics
Use the left- and right-arrows to see all of the
columns in the display.
12.6 Statistics
The controller can present some summary information
about the operation of the system – number of pump
cycles, number of burner cycles, etc.
How to get there –
Home Page
Fig. 135 – Statistics Configuration Screen
12.7 Analysis
The control system includes an Analysis branch
that can display the behavior over a period of time
for several different parameters: fan speed, outlet
temperature, inlet temperature, etc.
How to get there –
Home Page
Fig. 136 – Analysis Setup Screen
To use this function, select the parameter you want
to track from the pull-down list. The system will
present a graph that tracks that variable.
To see the graph for the currently-selected function,
press the View button.
Fig. 137 – Trend Analysis Graph
The time scale can be adjusted by pressing the
Seconds button in the lower left-hand corner.