Metrohm Vision – Diagnostics User Manual
Page 45
▪▪▪▪▪▪▪
43
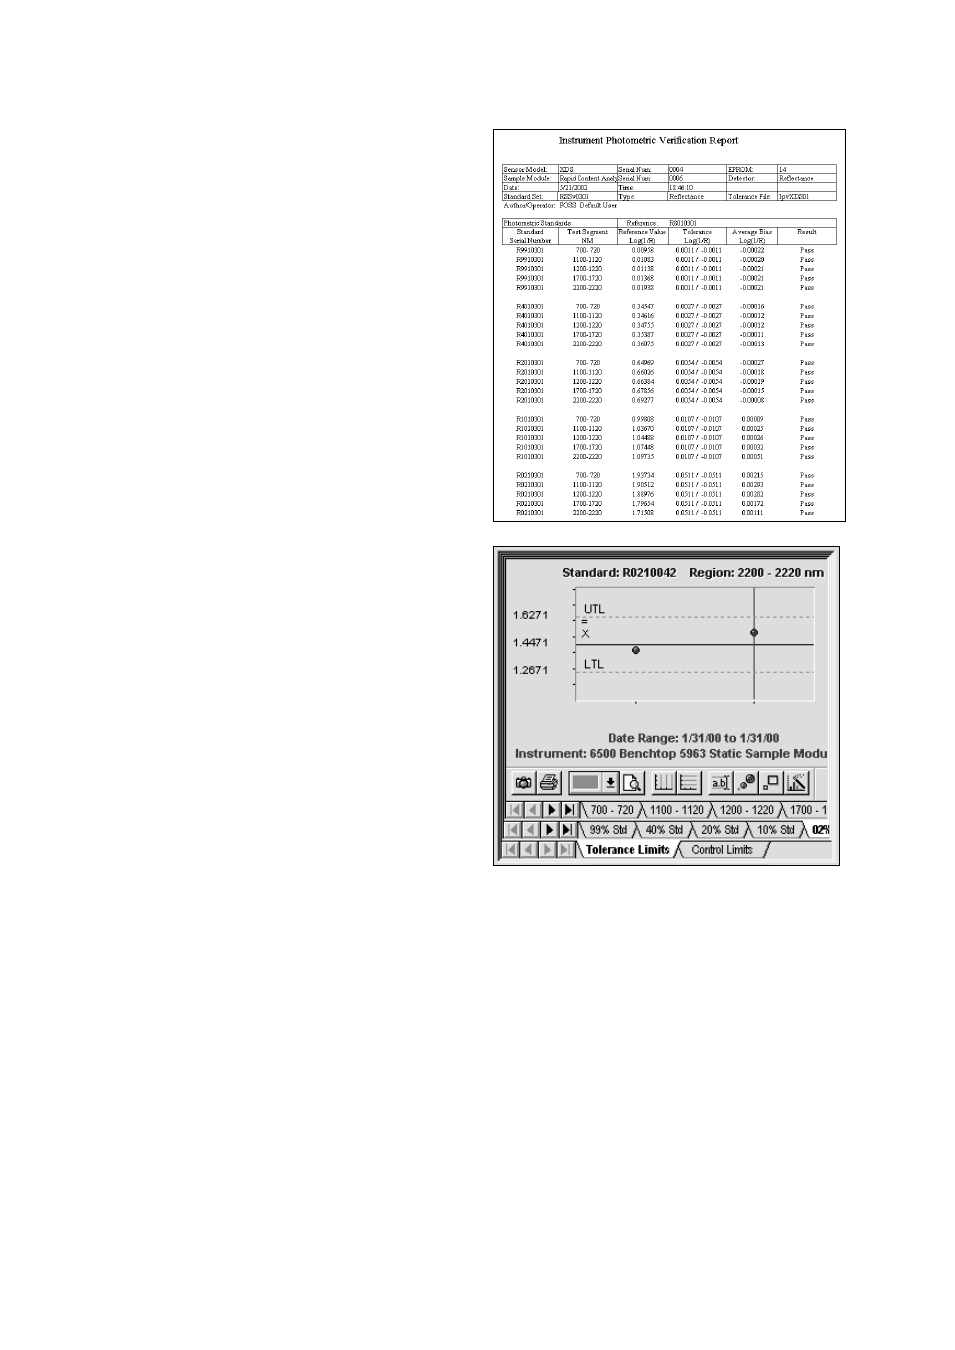
When Vision has completed the test, the
tabulated results may be printed. They are also
stored in the Diagnostic Database for later
recall.
When the test is complete, click “Close
Window”.
The control chart view is shown at right. The top
row of tabs is for selection of wavelength range
for viewing, as described above. The middle row
of tabs selects the standard. The 2% reflectance
is shown in this illustration.
The bottom tabs select between tolerance limits
(defined by Metrohm NIRSystems) or control
limits that are calculated on the specific
instrument being tested. Normally the control
limits will give the best indication of
performance.
See also other documents in the category Metrohm Equipment:
- 915 KF Ti-Touch (382 pages)
- 800 Dosino (53 pages)
- 767 Calibrated Reference (23 pages)
- 940 Professional IC Vario ONE/SeS/Prep 2 (54 pages)
- 754 Dialysis Unit (49 pages)
- 815 Robotic Soliprep for LC (76 pages)
- Vision Manual (207 pages)
- tiamo 2.1 Manual (1532 pages)
- 825 Lab Link (37 pages)
- 808 Titrando (70 pages)
- 902 Titrando (52 pages)
- 756 KF Coulometer (163 pages)
- 756 KF Coulometer (162 pages)
- 940 Professional IC Vario ONE/LPG (98 pages)
- 850 Professional IC Anion MCS Prep 3 (154 pages)
- 850 Professional IC Anion MCS Prep 3 (152 pages)
- 904 Titrando (58 pages)
- 850 Professional IC Anion MSM-HC MCS Prep 2 (150 pages)
- 930 Compact IC Flex Oven/ChS/Deg (47 pages)
- 872 Extension Module Liquid handling (64 pages)
- 814 USB Sample Processor (90 pages)
- 814 USB Sample Processor (91 pages)
- 940 Professional IC Vario (43 pages)
- Vision – Tutorial (40 pages)
- 799 GPT Titrino (242 pages)
- 889 IC Sample Center (68 pages)
- 761 Compact IC (228 pages)
- 851 Titrando (100 pages)
- 748 DH Sample Changer (32 pages)
- 940 Professional IC Vario ONE/SeS/HPG (51 pages)
- 896 Professional Detector – Amperometry (62 pages)
- 877 Titrino plus (139 pages)
- 881 Compact IC pro – Anion (129 pages)
- 940 Professional IC Vario ONE/ChS/HPG (112 pages)
- 930 Compact IC Flex Deg (41 pages)
- 840 PC Control 5.0 / Touch Control (351 pages)
- 940 Professional IC Vario ONE/Prep 1 (45 pages)
- 776 Dosimat (42 pages)
- 717 Sample Changer (36 pages)
- 815 Robotic USB Sample Processor XL (113 pages)
- 815 Robotic USB Sample Processor XL (114 pages)
- 940 Professional IC Vario ONE/SeS/PP (126 pages)
- 838 Advanced Sample Processor Installation Instructions (109 pages)
- 700 Dosino (55 pages)
- 719 S Titrino (152 pages)