Metrohm Vision – Diagnostics User Manual
Page 13
▪▪▪▪▪▪▪
11
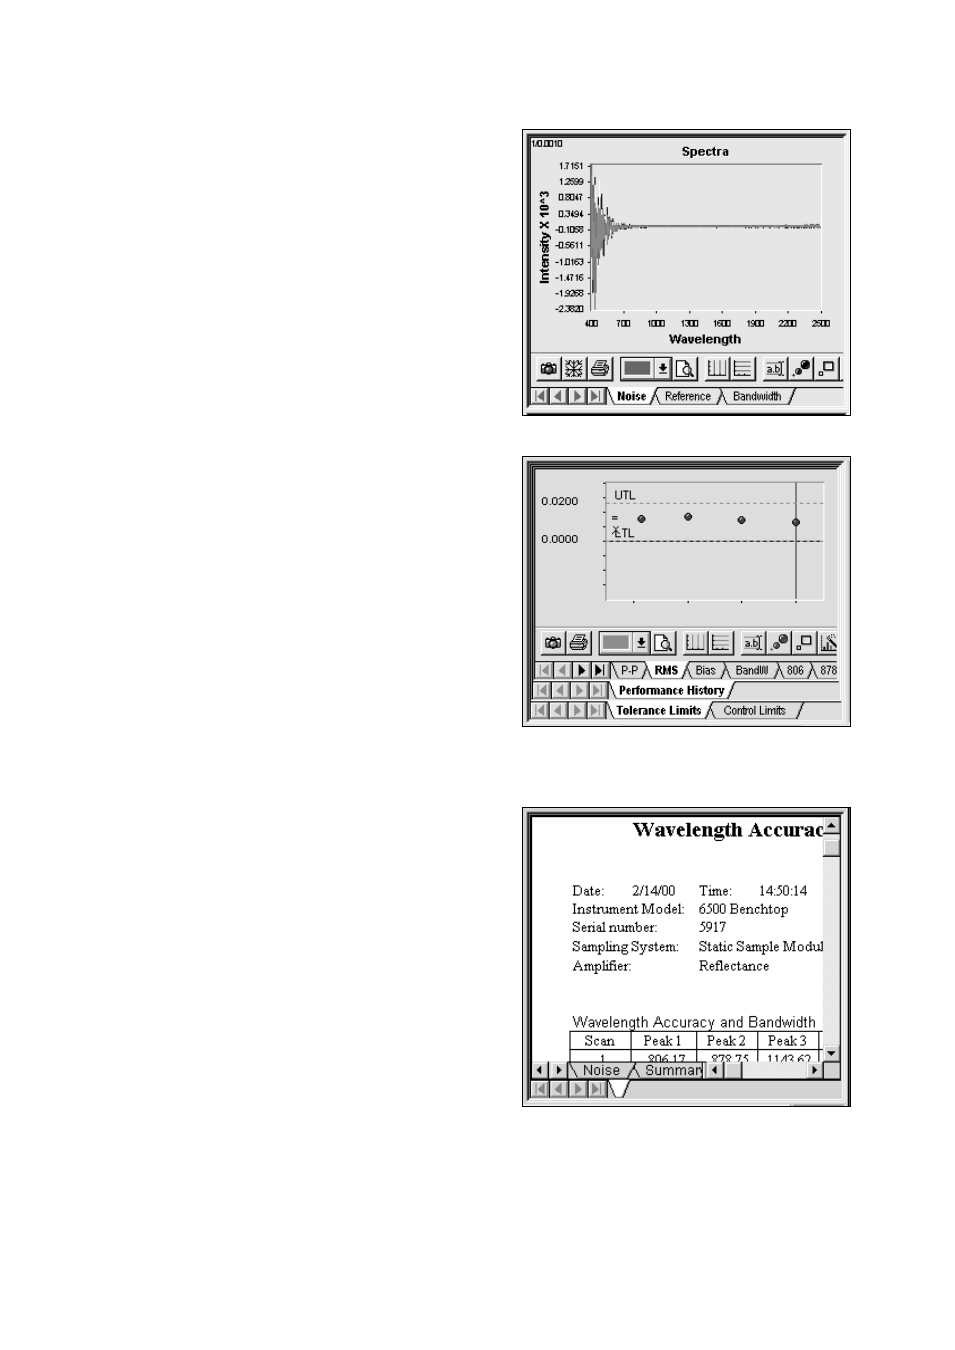
Other information displayed is the reference scan, or
the polystyrene/didymium spectra used for
wavelength linearization.
A left-click on the spectrum gives a cursor which
gives wavelength and absorbance information for a
selected spectrum, as throughout Vision. The
selected spectrum is identified by a color bar above
the wavelength and absorbance.
When this window is active the user may click on
the camera icon to copy the spectral image to the
clipboard. The user may click on the printer icon to
print spectra.
The lower left quadrant shows control charts, when
enough data is stored for a given instrument
configuration to plot control charts.
The top row of tabs is for selection of test (RMS
noise is shown). Other choices are Peak-to-Peak,
Bias, Bandwidth, and the Wavelength Linearization
peaks.
The bottom tabs select between tolerances or
control limits. Control limits are calculated on one
specific instrument and give an excellent insight into
any changes that may occur over time. Trends may
be noted and acted upon before the parameter has
gone outside of tolerance.
The lower right box shows tabular data. Click on the
tabs at the bottom to see each view. The options
are Noise, Summary, Wavelength, and OpQual
(Operational Qualification). The OpQual tabs provide
a summary of the actual instrument performance
versus specification values.
A double right click on the table takes the user to
Formula One Worksheet mode, which permits easy
cut-and-paste export of results to other
Windows™-based programs. When finished with
Formula One, click on the “X” to close.