Dashboard page – Google Web Security for Enterprise Administration Guide User Manual
Page 14
Administration Console
15
For each feature, a navigation menu will appear in the left-hand column. This
menu includes links to the following pages:
•
Reports: provides access to a number of custom management reports.
•
Management: enables the administrator to configure and deploy usage and
security policies for each of the web security services (this link is not included
with the Web Virus page).
•
Notifications: enables the administrator to set up user messages and email
alerts.
Dashboard Page
The Dashboard page appears when you click the Web Content tab in the
Administration Console. In the “View summary for” drop-down lists near the top of
the page, you can view graphs for different time periods and for different features,
such as Web Virus, Spyware, or Web Filtering.
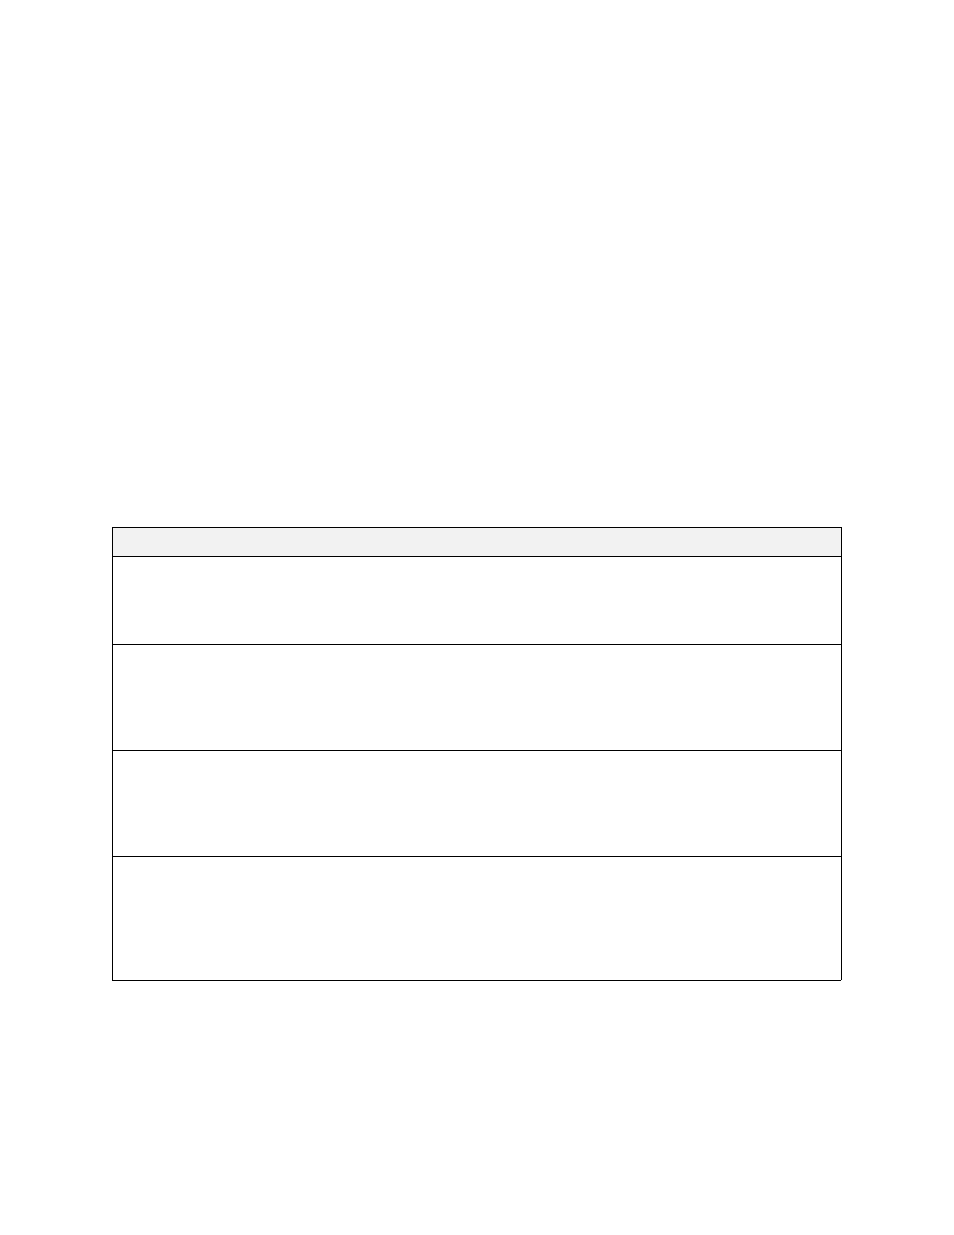
The table below provides the graphs that are visible for each of options in the
drop-down list:
Drop-down list
Left-hand graph
Right-hand graph
All
All blocks: Bar graph that displays the
number of blocks for all services (Web
Virus, Spyware, and Web Filtering) for a
given time period
HTTP hits: Line graph that displays the
number of HTTP hits from your
organization for a given time period
Web Virus
Web-Virus blocks: Line graph that
displays the number of Web-Virus blocks
for a given time period
Top 10 viruses by number of blocks:
Bar graph that displays the number of
blocks for each virus for a given time
period (the virus name appears during
scroll-over)
Spyware
Spyware blocks: Line graph that
displays the number of Spyware blocks
for a given time period
Top 10 spyware by number of blocks:
Bar graph that displays the number of
blocks for each spyware for a given time
period (the spyware name appears
during scroll-over)
Web Filtering
Web Filtering blocks: Line graph that
displays the number of Web Filtering
blocks for a given time period.
Top 10 categories by number of
connections: Bar graph that displays
the number of connections for each
web-page category for a given time
period (the category name appears
during scroll-over)