Captureplus ii – Cirrus Logic CapturePlus II User Manual
Page 29
CapturePlus II
DS789UM2
29
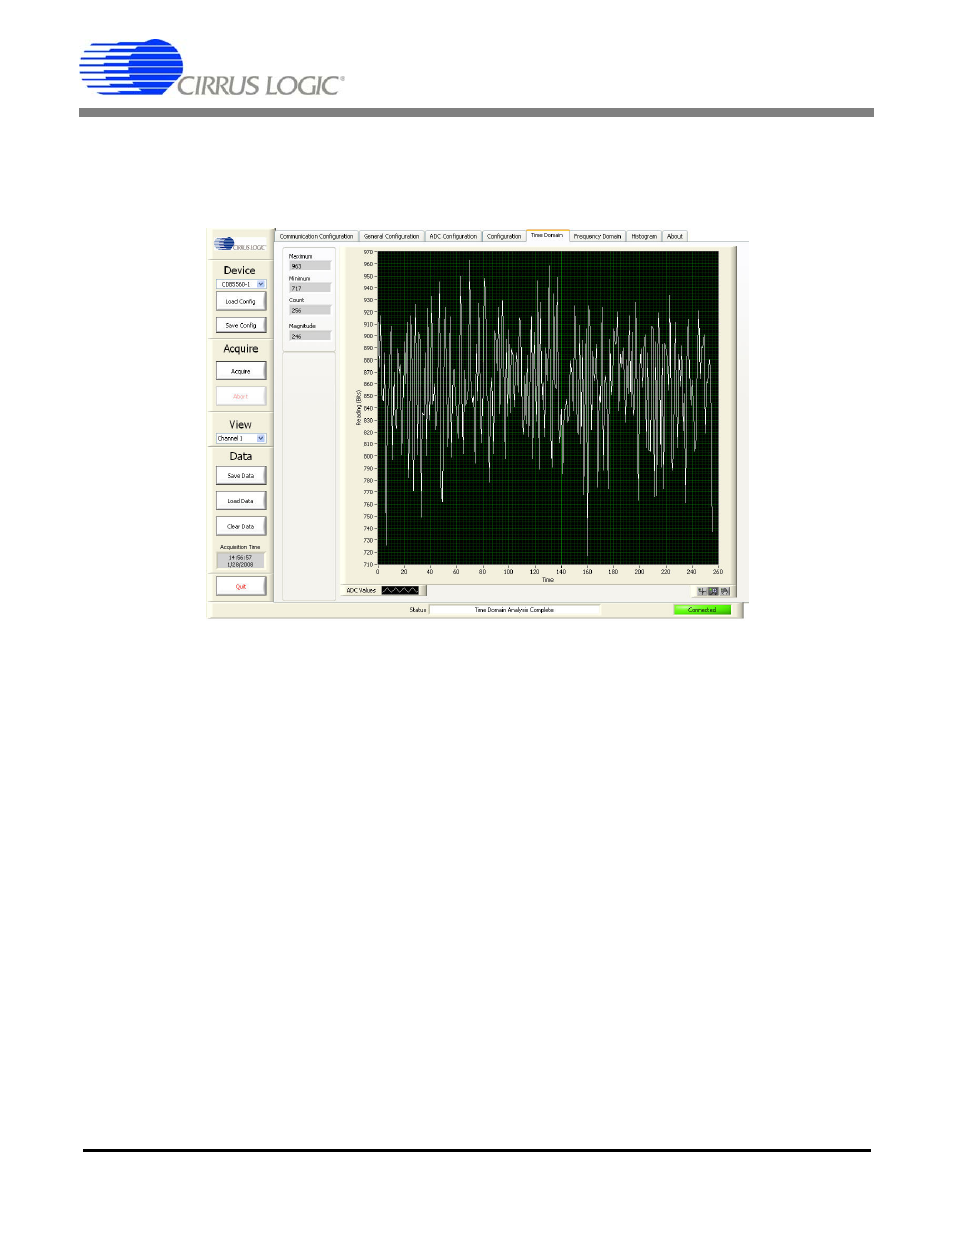
Start the test run by clicking OK. Upon completing the data capture, the screen will automatically display
the results. A typical time domain plot resulting from running a baseline test is shown below. Key infor-
mation calculated from the captured data and displayed is maximum, minimum, count (sample count), and
magnitude.
See also other documents in the category Cirrus Logic Hardware:
- CobraNet (147 pages)
- CS4961xx (54 pages)
- CS150x (8 pages)
- CS1501 (16 pages)
- CS1601 (2 pages)
- CS1601 (16 pages)
- CS1610 (16 pages)
- CRD1610-8W (24 pages)
- CRD1611-8W (25 pages)
- CDB1610-8W (21 pages)
- CS1610A (18 pages)
- CDB1611-8W (21 pages)
- CDB1610A-8W (21 pages)
- CDB1611A-8W (21 pages)
- CRD1610A-8W (24 pages)
- CRD1611A-8W (25 pages)
- CS1615 (16 pages)
- AN403 (15 pages)
- AN401 (14 pages)
- AN400 (15 pages)
- AN375 (27 pages)
- AN376 (9 pages)
- CRD1615-8W (22 pages)
- CRD1616-8W (23 pages)
- AN402 (14 pages)
- AN404 (15 pages)
- CRD1615A-8W (21 pages)
- CS1615A (16 pages)
- CS1630 (56 pages)
- AN374 (35 pages)
- AN368 (80 pages)
- CRD1630-10W (24 pages)
- CRD1631-10W (25 pages)
- CS1680 (16 pages)
- AN405 (13 pages)
- AN379 (31 pages)
- CRD1680-7W (31 pages)
- AN335 (10 pages)
- AN334 (6 pages)
- AN312 (14 pages)
- AN Integrating CobraNet into Audio Products (16 pages)
- CobraNet Audio Routing Primer (9 pages)
- Bundle Assignments in CobraNet Systems (3 pages)
- CS2300-01 (3 pages)
- CS2000-CP (38 pages)