5 time domain tab, Captureplus ii – Cirrus Logic CapturePlus II User Manual
Page 16
CapturePlus II
16
DS789UM2
4.2.5
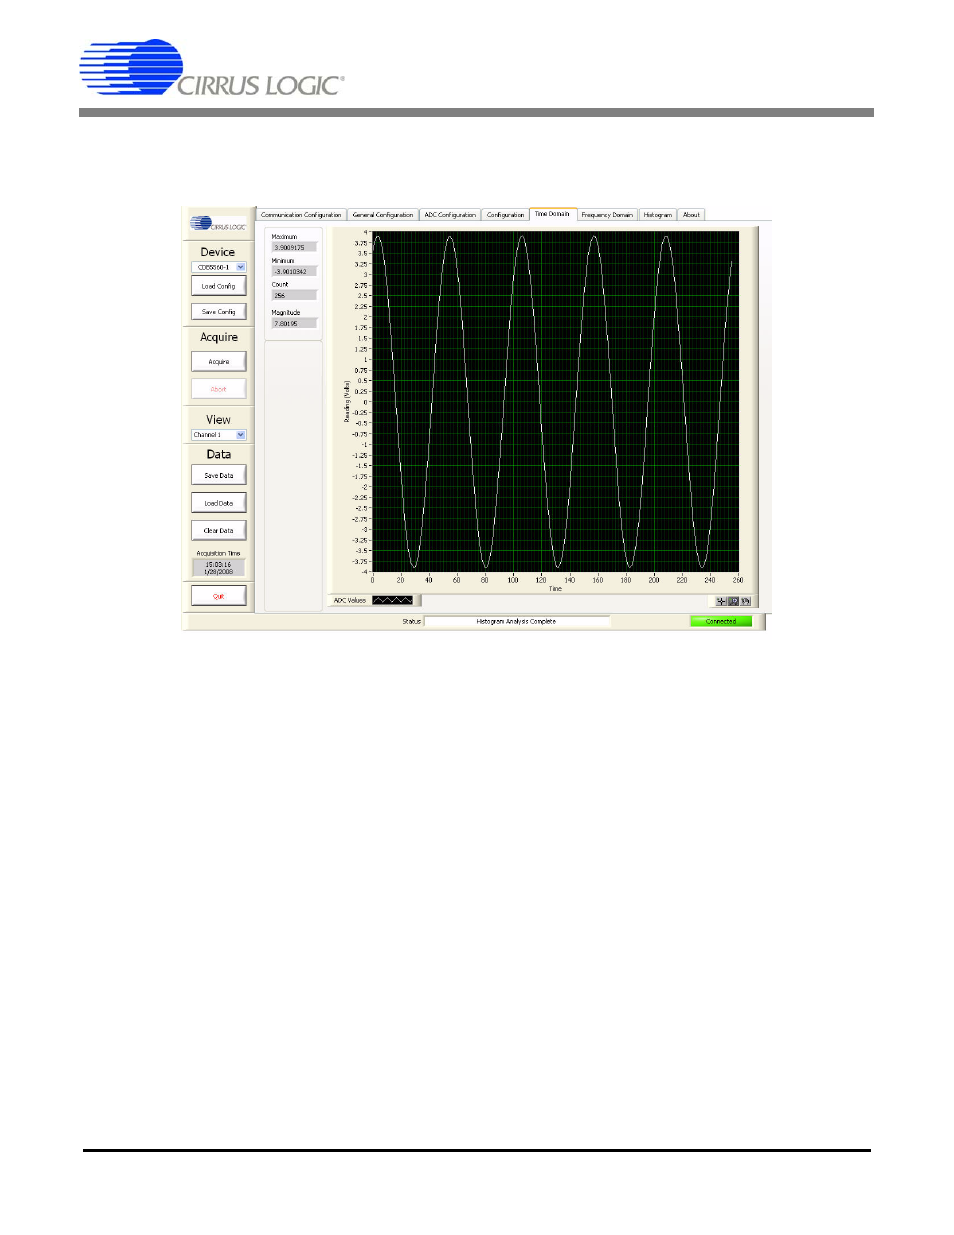
Time Domain Tab
The Time Domain tab displays the data set in the time domain. Select the Time Domain tab to display
this panel. Click on any other tab to exit this panel.
The Time Domain tab consists of the following controls:
– Data Graph: The Data Graph provides an x-y plot of the data set in the time domain.
X-axis: Plots the sample number: Use the x-axis scaling to determine the position of any sample
within the data set sequence. For any given plotted data point, the number displayed along the
x-axis represents the sample number in the data set sequence.
Y-axis: Plots the magnitude of the reading in either volts or bits. Use the y-axis scaling to
measure the magnitude of the plotted data.
ADC Values: This menu provides data set graphing options. Click on the ADC Values button
to open the ADC Values menu.
Graph Zoom: The Graph Zoom functions are available at the bottom right corner of the graph.
Also, the Minimum and Maximum x-axis and y-axis index numbers can be manually changed by
applying a clicking on the minimum and maximum index numbers and entering a new value.
– Maximum: Displays the maximum y-axis value for the graphed data set. Units are the same as
the data graph y-axis units (volts or bits).
– Minimum: Displays the minimum y-axis value for the graphed data set. Units are the same as the
data graph y-axis units (volts or bits).
– Count: Displays the data set sample size.
– Magnitude: Displays the difference between the maximum and minimum values for the graphed
data set. Units are the same as the Data Graph y-axis units (volts or bits).