7 histogram tab, Captureplus ii – Cirrus Logic CapturePlus II User Manual
Page 19
CapturePlus II
DS789UM2
19
4.2.7
Histogram Tab
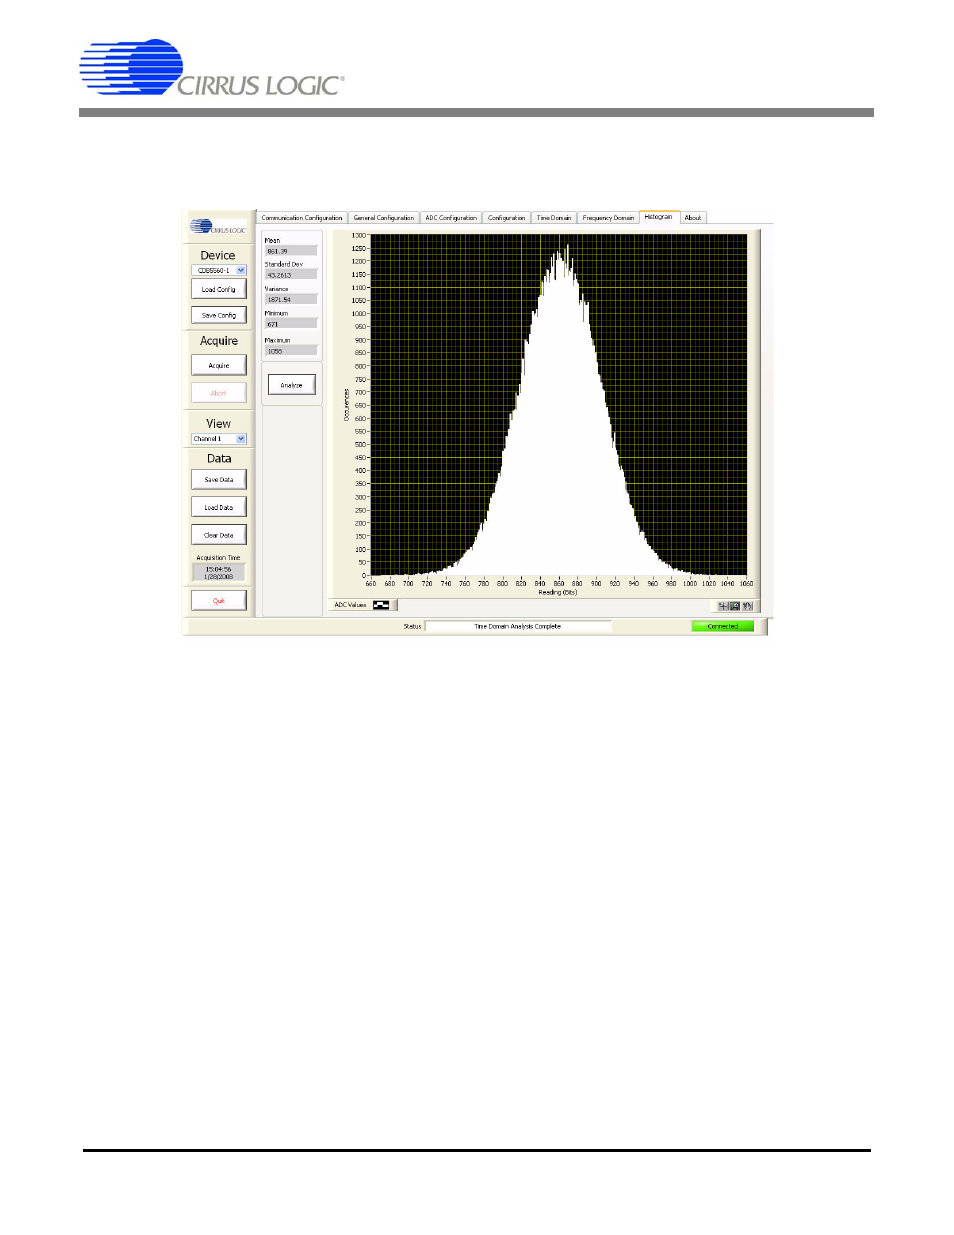
The Histogram tab displays the data set using statistical analysis. Select the Histogram tab to display this
panel. Click on any other tab to exit this panel.
The Histogram tab consists of the following controls:
– Analyze: After acquiring one or more data sets the Software will pause and wait for the Analyze
button to be activated. Click on the Analyze button to analyze the data set and display the results.
Only the last data set acquired is analyzed.
– Data Graph: The Data Graph provides a histogram distribution of the data set.
X-axis: Plots the reading (bits or volts). The x-axis index units are selected by the Magnitude
Display button within the Configuration panel.
Y-axis: Plots occurrences: The y-axis indicates the number of times a particular value occurred.
ADC Values: This menu provides data set graphing options. Click on the ADC Values menu to
activate it.
Graph Zoom: This menu provides graph zoom options. Click on the Graph Zoom buttons to
access the zoom functions. Also, the x-axis and y-axis scaling can be changed by clicking on
the minimum or maximum index numbers and manually entering a new value.
– Mean: The mean statistical measurement is in units of volts or LSBs (least significant bits). The
mean statistical measurement units are set by the Magnitude Display button in the General
Configuration menu.
– Standard Dev: The standard deviation statistical measurement is in units of volts or LSBs (least
significant bits). The standard deviation statistical measurement units are set by the Magnitude
Display button in the General Configuration menu. If the units are volts, the standard deviation
represents volts RMS.