6 frequency domain tab, Captureplus ii – Cirrus Logic CapturePlus II User Manual
Page 17
CapturePlus II
DS789UM2
17
4.2.6
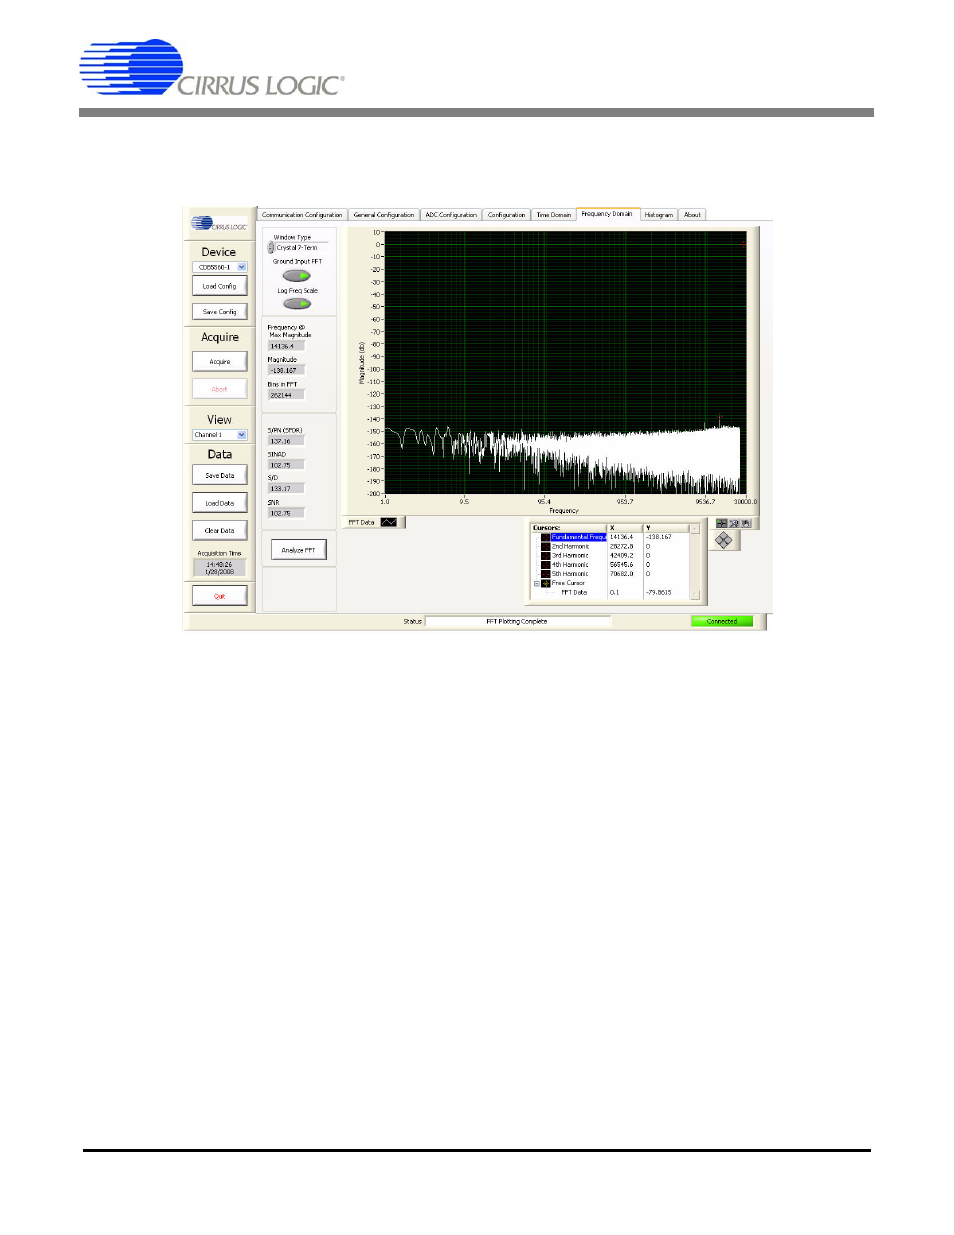
Frequency Domain Tab
The Frequency Domain tab displays the data set in the frequency domain. Select the Frequency Domain
tab to display this panel. Click on any other tab to exit this panel.
The Frequency Domain tab consists of the following controls:
– Data Graph: The Data Graph provides an x-y plot of the data set in the frequency domain.
X-axis: Plots Frequency in Hertz. The x-axis index is in units of Hertz for the FFT frequency bins.
Bin size is based upon the ADC data sample rate.
Y-axis: plots voltage magnitude (dBFS). The y-axis provides an index in units of Voltage dBFS for
the voltage magnitude of a given FFT frequency bin.
ADC Values: This menu provides data set graphing options. Click on the ADC Values icon to open
the ADC Values menu.
Graph Zoom: The Graph Zoom functions are available at the bottom right corner of the graph.
Also, the Minimum and Maximum x-axis and y-axis index numbers can be manually changed by
applying a clicking on the minimum and maximum index numbers and entering a new value.
– Window Type: Change the FFT windowing function by activating the Window Type Up / Down
buttons. Display the current data set using the selected windowing function by clicking the Analyze
FFT button.
Three windowing functions are available:
Rectangular: The Rectangular Windowing Function is optimized for measuring FFT broad band
noise. It is used primarily for examining the noise floor produced by a Grounded Input FFT without
any input signal.
Hodie 5 Term: The Hodie 5 Term Windowing Function is a proprietary 5-term digital filter optimized
for examining an FFT with spectral content. It has a processing loss of 3.457 dB and side lobe