Figure a-1 – Campbell Scientific EC155 CO2 and H2O Closed-Path Gas Analyzer and EC100 Electronics with Optional CSAT3A 3D Sonic Anemometer User Manual
Page 56
Appendix A. Filter Bandwidth and Time Delay
the non-EC100 data by two datalogger scans to match the EC100 data. For the
best synchronicity, choose a datalogger scan interval that is an integer multiple
of the EC100 filter delay.
The EC100 measures the gas and wind data at 100 Hz, and the 100-Hz data are
down-sampled to the datalogger’s scan rate through SDM communications (see
Section 8, EC100 Outputs). This process synchronizes the EC100 gas and
wind data with other signals measured by the datalogger to within ±3.333 ms
(plus or minus one-half of the inverse of 100 Hz). Alternatively, when sending
data to a non-Campbell data acquisition system, the EC100 down-samples its
USB and RS-485 outputs to a user-selectable rate of 10, 25, or 50 Hz.
Although the gas and wind data from the EC100 remain synchronized with one
another, the user must consider the down-sampled output interval when
synchronizing the EC100 data with other measurements in their system. These
slower output intervals will increase the asynchronicity of EC100 data with
other system measurements.
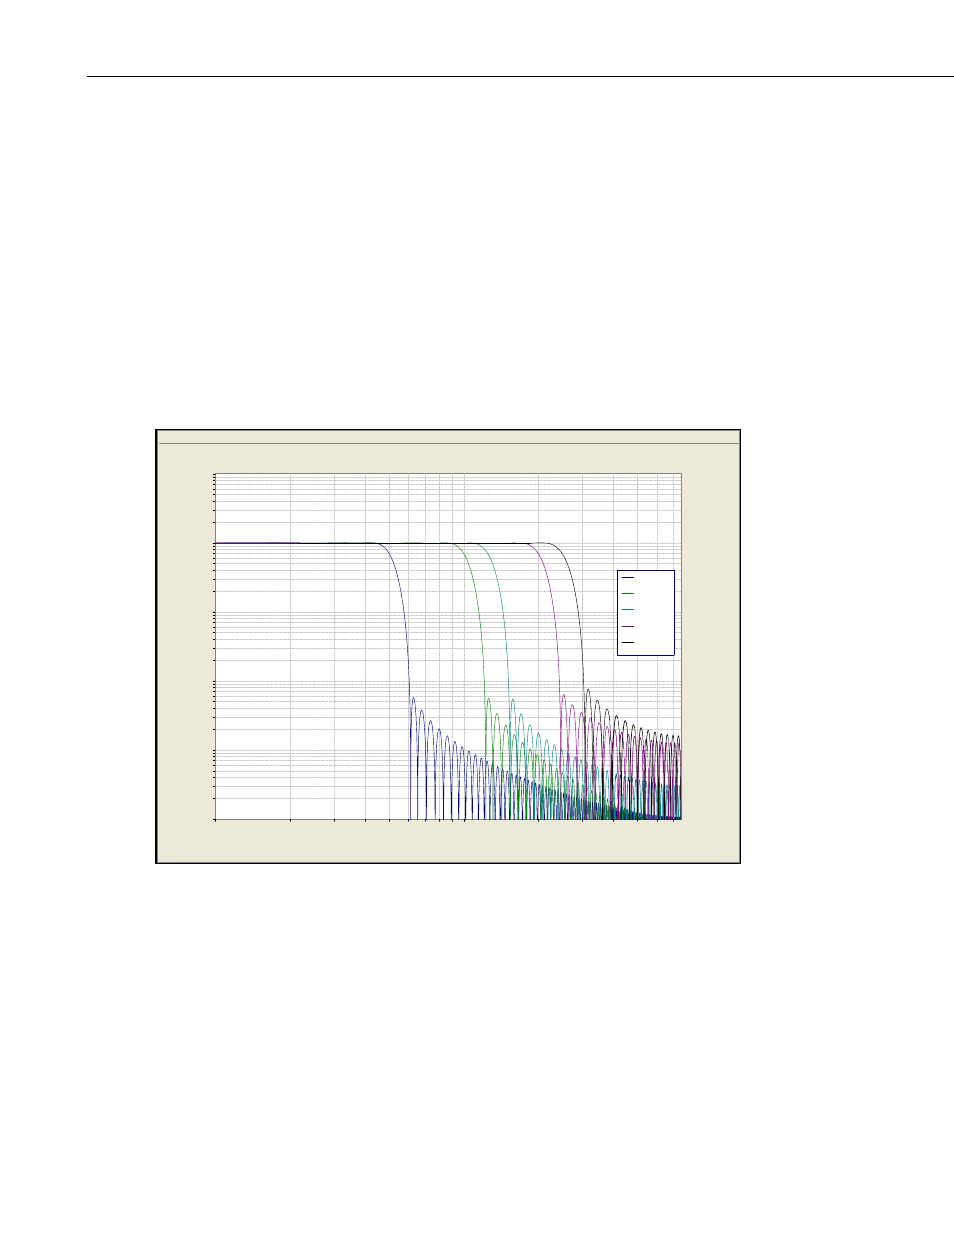
FIGURE A-1. Frequency and amplitude response of the EC100 filter at
various bandwidths
1
10
70
Hertz
0.0001
0.001
0.01
0.1
1
10
N
o U
ni
ts
5 Hz
10 Hz
12.5 Hz
20 Hz
25 Hz
EC100 Bandwidths (Amplitude Responses)
A-2