DAVIS Vantage Vue Wireless Console Manual User Manual
Page 39
Graph Mode
35
View graphs of all other variables the same way.
1. Select the variable you want to view.
2. Press GRAPH.
3. Use the < and > keys to select different values.
4. Press the + key to shorten the time range.
5. Press the - key to lengthen the time range.
6. Press HI/LOW to shift between highs and lows.
7. Press DONE to exit.
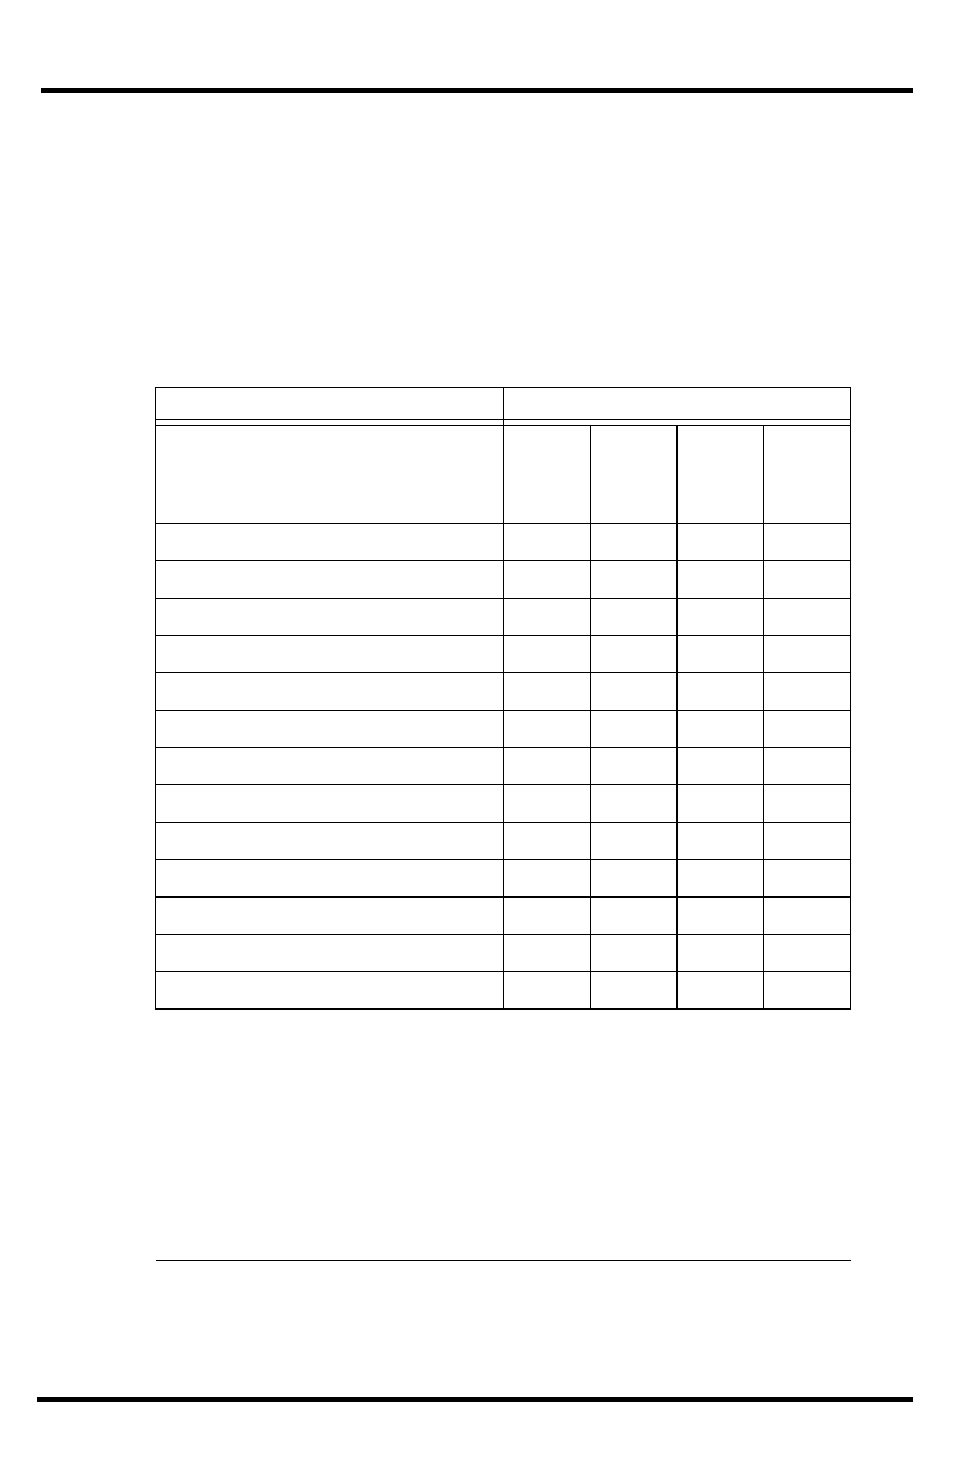
Vantage Vue Console Graphs
Weather Variable
Available Graphs
Hourly
Daily
Monthly
Yearly
Barometric Pressure
C
H, L
H, L
Humidity, Inside
C
H, L
H, L
Humidity, Outside
C
H, L
H, L
Dew Point
C
H, L
H, L
Rain
T
T
T
T
Rain Rate
H
H
H
H
ET (optional)
T
T
T
T
Inside Temperature
C
H, L
H, L
Outside Temperature
C
H, L
H, L
Heat Index Temperature
C
H
H
Wind Chill Temperature
L
L
L
Wind Speed*
A, H
H
H
Direction of High Wind Speed
Y
Y
Legend:
A = Average
H = Highs
L = Lows
T =Totals
Y = Yes
C = Current reading at the end of each period
* Also available: 10-Minute High Wind Speeds For Last 4 Hours; Current
and last 25 Packets of Wind Speed.
- Envoy8X Getting Started Guide (16 pages)
- Vantage Pro2 Long Range Repeater Installation Addendum (16 pages)
- Wireless Temperature Station (6372) Installation Manual (12 pages)
- Solar Power Kit For Vantage Weather Stations and Envoy8X (8 pages)
- Energy EnviroMonitor: Console (63 pages)
- EZ-Mount Installation (16 pages)
- Gro/Energy/Health Installation (24 pages)
- GroWeather Console (65 pages)
- GroWeather/EnviroMonitor: Systems Installation (24 pages)
- Health EnviroMonitor: Console (60 pages)
- Anemometer (7911, 7914) (8 pages)
- Rain Collector II for GroWeather, EnviroMonitor, Weather Monitor and Wizard (16 pages)
- Sensor - UV for GroWeather or EnviroMonitor (16 pages)
- Solar Radiation Sensor for GroWeather and EnviroMonitor (16 pages)
- Temperatur/Humidity Sensor for GroWeather, EnviroMonitor, & Weather Monitor (12 pages)
- Temperature Sensor/Probe for GroWeather, EnviroMon., Weather Monitor/Wizard (4 pages)
- GroWeatherLink Software (108 pages)
- GroWeatherLink/ET Data Logger (2 pages)
- Short-Range Modem Pair: Perception, GroWeather, EnviroMon., Monitor, Wizard (8 pages)
- Alarm Output Module (16 pages)
- Cable Coupler Kit (4 pages)
- Cable Crimp-Type Splice Connector (4 pages)
- Complete System Shelter (12 pages)
- Fan-Aspirated Radiation Shield (24 pages)
- Grounding Kit (4 pages)
- Interface Cable Adapter Module (8 pages)
- Mounting Pole Kit Installation (4 pages)
- Mounting Tripod Kit (8 pages)
- Multi-purpose Shelter (12 pages)
- Radiation Shield (7714) (16 pages)
- Radio Surge Protector (4 pages)
- Rain Collector Heater (12 pages)
- Rain Collector Shelf: GroWeather, EnviroMonitor, Weather Monitor & Wizard (8 pages)
- Second Solar Panel for EZ-Mount Solar Power Kit (4 pages)
- Sensor Mounting Arm for GroWeather, EnviroMonitor, Weather Monitor & Wizard (16 pages)
- Sensor Tilting Bracket for GroWeather or EnviroMonitor (8 pages)
- Shelter Heaters (12 pages)
- Solar Power Kit for Non-Vantage Pro Stations (16 pages)
- Surge Protector (2 pages)
- Surge Protector Shelter - Large (8 pages)
- Surge Protector Shelter - Small (4 pages)
- Terminal Box for sensors/interface module, communication lines: GroWeather (8 pages)
- WeatherLink for Windows 4.0 (116 pages)
- WeatherLink Getting Started Guide (20 pages)
- WeatherLink Mac OS X Getting Started Guide (16 pages)