Figure 3 quicktools interface, Fabric tree, Graphic window – HP SN6000 Fibre Channel Switch User Manual
Page 15: Data windows and tabs, 3 quicktools interface, Quicktools interface, Figure 3
HP StorageWorks SN6000 Fibre Channel Switch QuickTools Switch Management User Guide
15
Figure 3
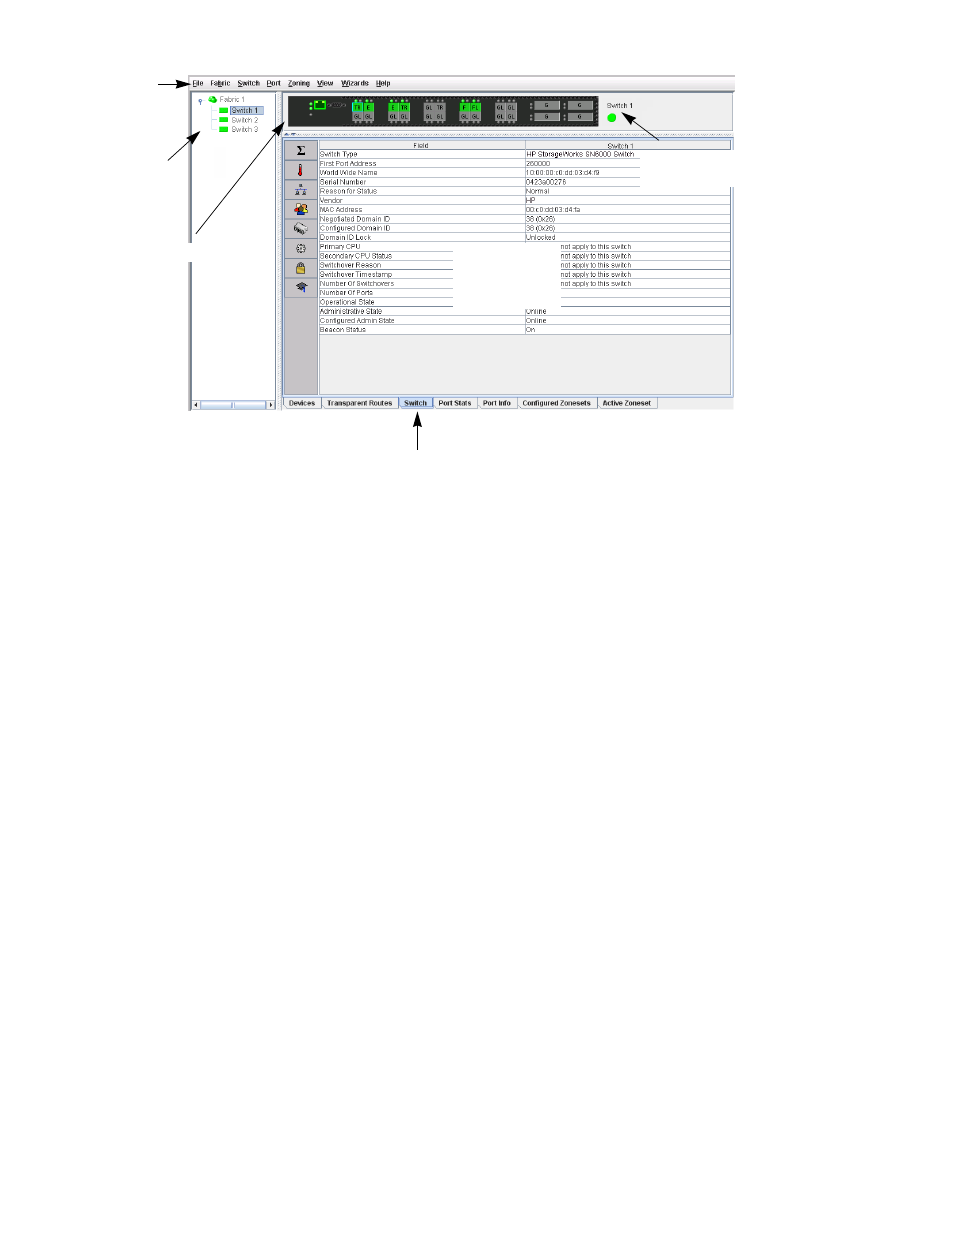
QuickTools interface
Fabric tree
The QuickTools web applet enables you to manage the switches in one fabric. The fabric tree (
provides access to each switch faceplate display in the fabric. Click a switch name or icon to display that
switch faceplate in the graphic window. The width of the fabric tree window can be adjusted by clicking
and dragging the moveable window border.
Next to each fabric tree entry is a small icon that uses color to indicate operational status:
•
A green icon indicates normal operation.
•
A yellow icon indicates that a switch is operational, but may require attention to maintain maximum
performance.
•
A red icon indicates a potential failure or non-operational state, as when the switch is offline.
•
A blue icon indicates that a switch is unknown, unreachable, or unmanageable.
If the status of the fabric is not normal, the fabric icon in the fabric tree indicates the reason for the
abnormal status. The same message is provided when you rest the mouse on the fabric icon in the fabric
tree.
Graphic window
The graphic window shows either the front of a switch (the faceplate, as shown in
) or the back of
the switch (the backplate). The height of the window can be adjusted by clicking and dragging the border
that it shares with the data window. To view the faceplate display, select View > View Faceplate. To view
the backplate display, select View > View Backplate.
Data windows and tabs
The data window (
) displays a table of data and statistics associated with the selected tab for the
switch displayed in the graphic window. Use the scroll bar to browse through the data. To adjust the length
of the window, click and drag the border that it shares with the graphic window.To adjust the column
width, move the pointer over the column heading border shared by two columns until a right/left arrow
graphic is displayed. Click and drag the arrow to the desired width.
The data windows and tabs are described below:
Data window tabs
Graphic window
Fabric
tree
Menu
bar
Data window
Fabric/Switch name
and status