Performing offline analysis, Reading the analysis information, System details pane – HP Insight Control User Manual
Page 20
Performing Offline Analysis
The Offline Analysis tool enables performance data to be viewed from a database that has been
captured and logged over a specified time.
The Offline Analysis tool enables you to view recorded data sessions from the Performance
Management database.
To use Offline Analysis:
1.
From the Insight Control/Insight Dynamics console toolbar, click Diagnose
→Performance
Management
→Offline Analysis.
2.
Select the checkbox next to the server or select multiple servers for which you wish to view the
performance data.
3.
Click Apply Selections
→Run Now.
4.
Select the start date in the date selection column for a server to display the performance data.
5.
Click Start Offline Analysis.
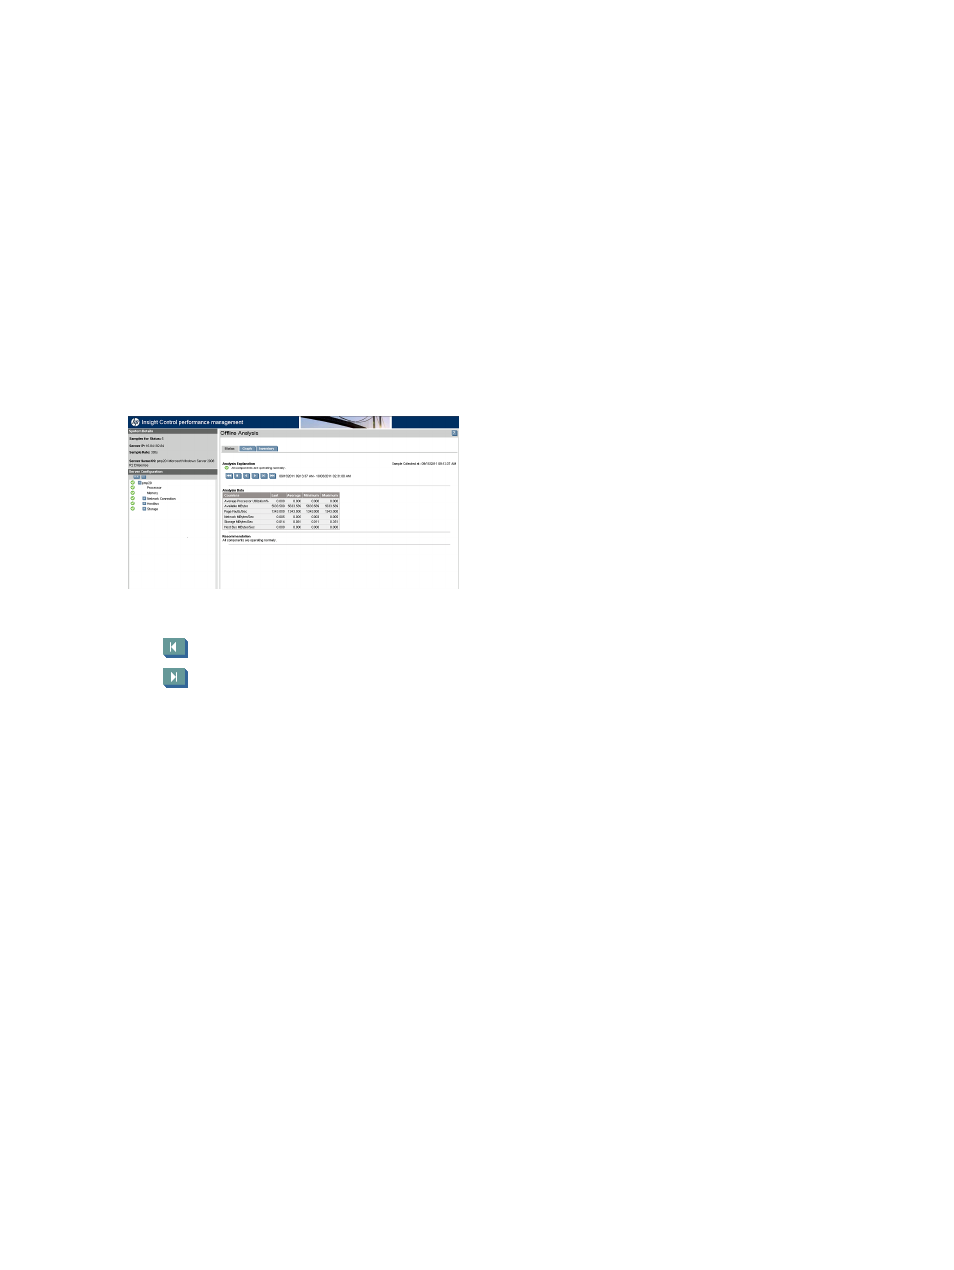
After selecting offline analysis parameters, the session appears as illustrated in the following figure.
The following icons are provided for bottleneck navigation:
•
back to the previous bottleneck
•
forward to the next bottleneck
For example, if a status change happens at 6:00 a.m. from green to amber, yellow to amber, or
green to yellow, click the Next or Previous bottleneck navigation button and the Offline Analysis
page for 6:00 a.m. appears. However, if the status changes at 6:00 a.m. from amber to yellow,
amber to green, or yellow to green, the next bottleneck button does not navigate to that time.
Insight Control performance management Offline Analysis can detect hardware configuration
changes.
Reading the analysis information
The subsequent sections discuss the various methods of reading the analysis information.
The different panes of analysis information that appears on a Online/Offline Analysis page is as
detailed below:
System Details pane
The Systems detail pane appears at the top left side of the browser window below the banner and
provides the following information:
•
Server name - Displays the name of the server currently being monitored
•
Server OS - Displays the operating system version of the server currently being monitored
•
Server IP - Displays the IP address assigned to the server currently being monitored
•
Sample Rate - Displays the frequency with which the agents are collecting performance data
on the monitored server
20
Analyzing the server performance