3 monitoring the server performance, Overview, Using the performance management interface – HP Insight Control User Manual
Page 13: Opening the hp insight control console

3 Monitoring the server performance
Overview
This chapter provides an overview of the complete Performance Management functionality. The
functionalities discussed in this chapter includes:
•
Insight Control performance management interface
•
Monitoring Administration page
Default Performance Management monitoring settings
◦
◦
Setting Performance Management parameters
◦
Number of samples
◦
Sample rate
◦
Setting performance threshold
◦
Setting the log days
•
Manual Log Purge page
Using the Performance Management interface
This section provides an overview of Performance Management functionality. A usage scenario
demonstrates setup, administration, and server monitoring.
Opening the HP Insight Control console
For information on how to access the Insight Control console using the Internet Explorer or Firefox,
see the HP Systems Insight Manager 7.0 User Guide.
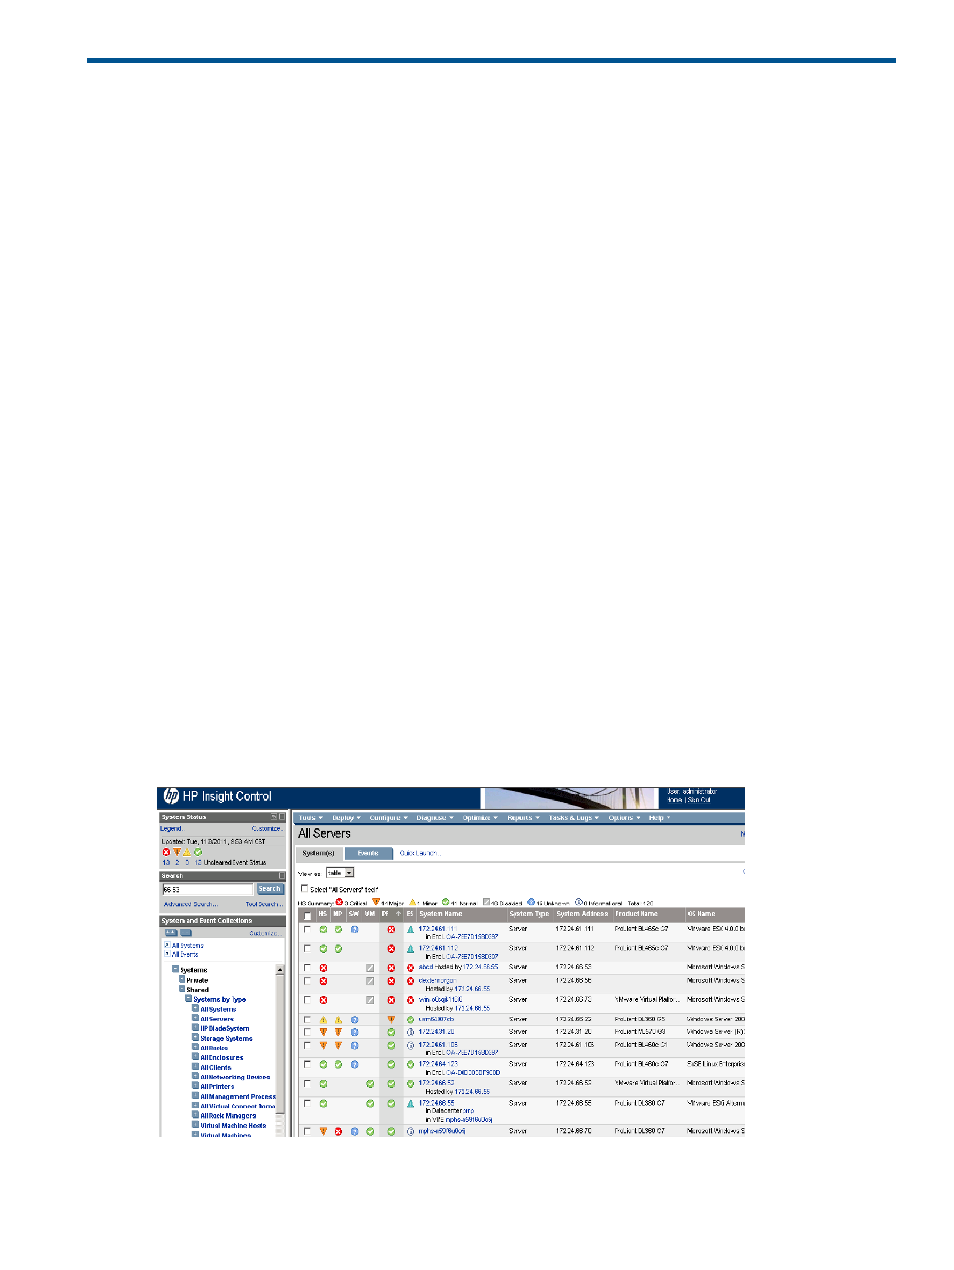
The HP Insight Control console, which appears in an Internet Explorer browser window, shows the
performance status in the PF column. Icons in this column indicate the current performance state
of a server.
In the following figure, an amber (Major) icon indicates that a bottleneck condition exists on the
selected server.
Overview
13
