Displaying the memory status, Displaying the memory graph – HP Insight Control User Manual
Page 66
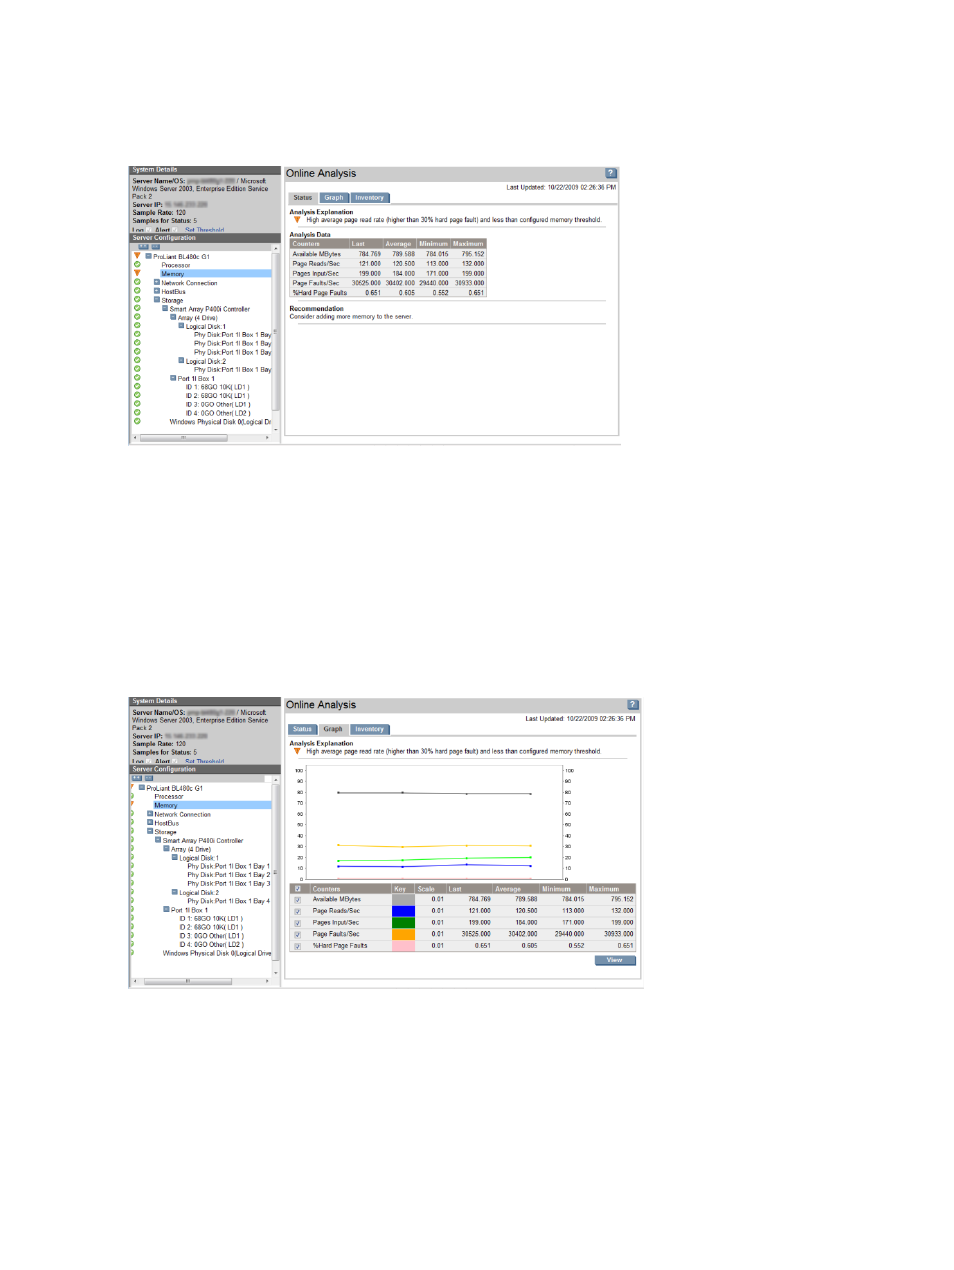
Displaying the memory status
In the Server Configuration frame, to access the memory information and display the Status page
for memory in the Results frame, select Memory. Related and important memory counters appear
in the Analysis Data table.
The Analysis Explanation details an above-average page—read rate (higher than 30% of the hard
page fault), and less than configured memory threshold. The analysis recommends more physical
memory to handle the load. Many recommendations suggest adding hardware.
In this example, the situation might have occurred because a new batch job was assigned to run
on the server at night. The remainder of this scenario examines other performance information
available to assist in troubleshooting to determine if immediate action is required to resolve the
performance bottleneck.
Displaying the memory graph
To show a graphical display of memory counters in the Results pane, click the Graph tab.
This graph displays the number of samples as selected in Monitoring Administration Page. The
duration of the graph would be for a period same as sample rate (default 120) multiplied by
Number of Samples.
The pattern of the graph shows rising, peaking, and declining, which might be caused by the
completion of the new batch job. The batch job no longer causes a problem. However, the
performance information is logged in the database for later review with the Offline Analysis tool.
66
Bottleneck scenarios