Importing statistics – HP Prime Graphing Wireless Calculator User Manual
Page 78
74
Inference app
Plot the test
results
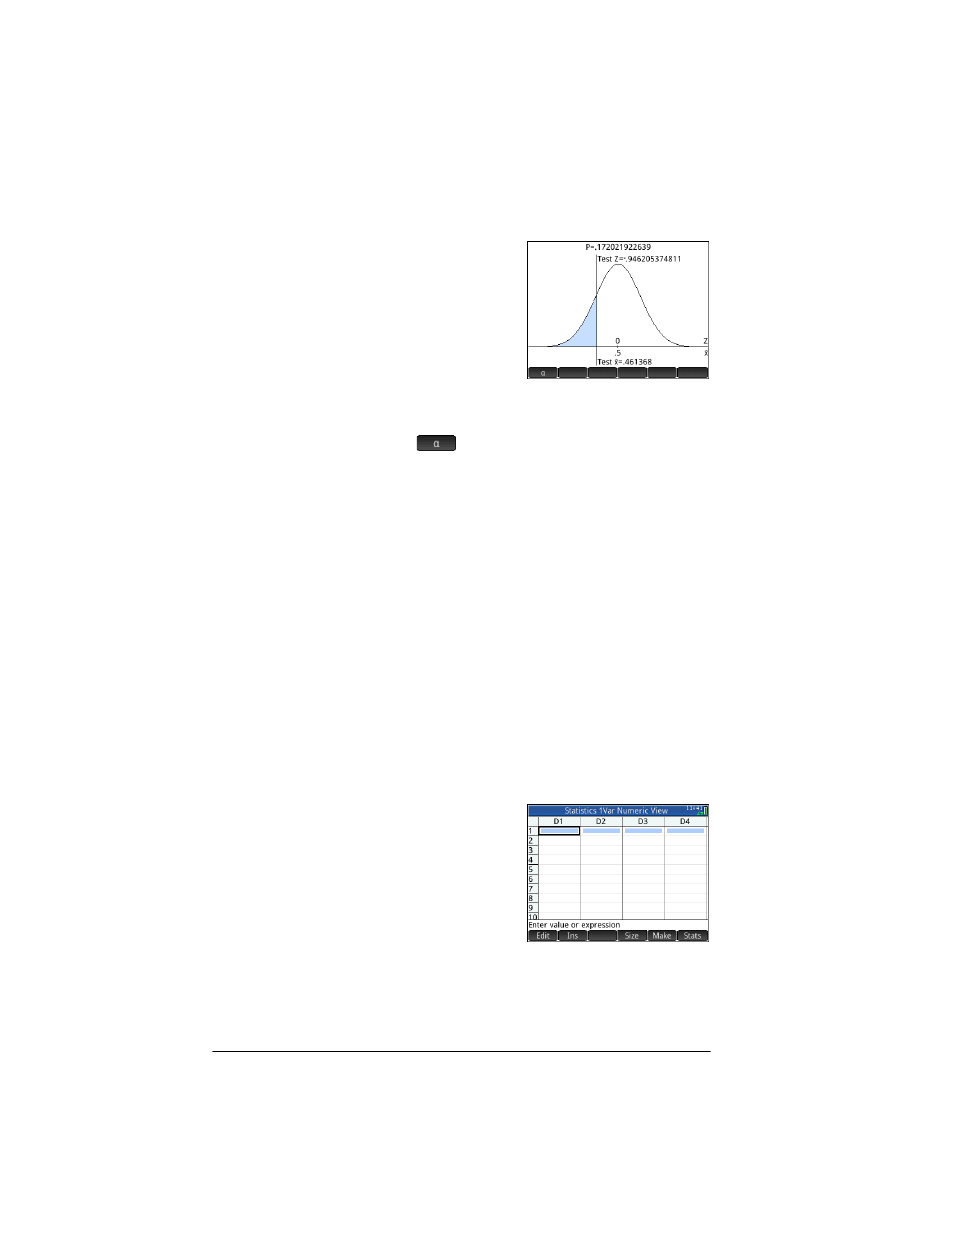
7. Display a graphical
view of the test
results:
P
The graph of the
distribution is
displayed, with the
test Z-value marked. The corresponding X-value is also
shown.
Tap
to see the critical Z-value. With the alpha
level showing, you can press
\
or
=
to decrease or
increase the α-level.
Importing statistics
For many of the calculations, the Inference app can
import summary statistics from data in the Statistics 1Var
and Statistics 2Var apps. For the others, the data can be
manually imported. The following example illustrates the
process.
A series of six experiments gives the following values as
the boiling point of a liquid:
82.5, 83.1, 82.6, 83.7, 82.4, and 83.0
Based on this sample, we want to estimate the true boiling
point at the 90% confidence level.
Open the
Statistics
1Var app
1.
Open the Statistics
1Var app:
I
Select
Statistics 1Var
Clear
unwanted
data
2. If there is unwanted data in the app, clear it:
SJ
All columns
- iPAQ Glisten (185 pages)
- iPAQ Glisten-AT&T (185 pages)
- iPAQ rx5900 Travel Companion (10 pages)
- iPAQ h1900 Pocket PC series (127 pages)
- iPAQ hx2700 Pocket PC series (168 pages)
- QuickSpecs H5400 (13 pages)
- 620LX (172 pages)
- IPAQ H1930 (13 pages)
- 700 Series (204 pages)
- iPAQ h5150 (8 pages)
- Jornada 420 (146 pages)
- iPAQ PC h1910 (2 pages)
- HX2000 (11 pages)
- iPAQ hx2000 Series (3 pages)
- h4000 (141 pages)
- iPAQ HX2495b (10 pages)
- 820e (178 pages)
- 820 (186 pages)
- iPAQ h1910 (105 pages)
- iPAQ hx2790c (10 pages)
- IPAQ Pocket PC hx2110 (7 pages)
- rx3000 Series (301 pages)
- iPAQ hx4700 (169 pages)
- 2490 (14 pages)
- iPAQ hw6500 (170 pages)
- h6300 (190 pages)
- IPAQ HX2750 (9 pages)
- iPAQ h2200 Pocket PC series (125 pages)
- iPAQ Pocket PC h5400 Series (10 pages)
- Jornada 520 (134 pages)
- iPAQ h4100 Pocket PC series (143 pages)
- IPAQ H5100 (169 pages)
- h5400 (273 pages)
- IPAQ RX3000 (60 pages)
- H2200 (9 pages)
- UNIX AA-XXXXX-TF (15 pages)
- Jornada 540 Series (135 pages)
- PC Series (22 pages)
- 430se (151 pages)
- h1937 EN (127 pages)
- PrintCalc 100 (33 pages)
- PrintCalc 100 (32 pages)
- 48gII Graphing Calculator (892 pages)
- 48gII Graphing Calculator (864 pages)
- EliteBook 2740p Tablet-PC (179 pages)