Plot – HP Prime Graphing Wireless Calculator User Manual
Page 34
30
Geometry
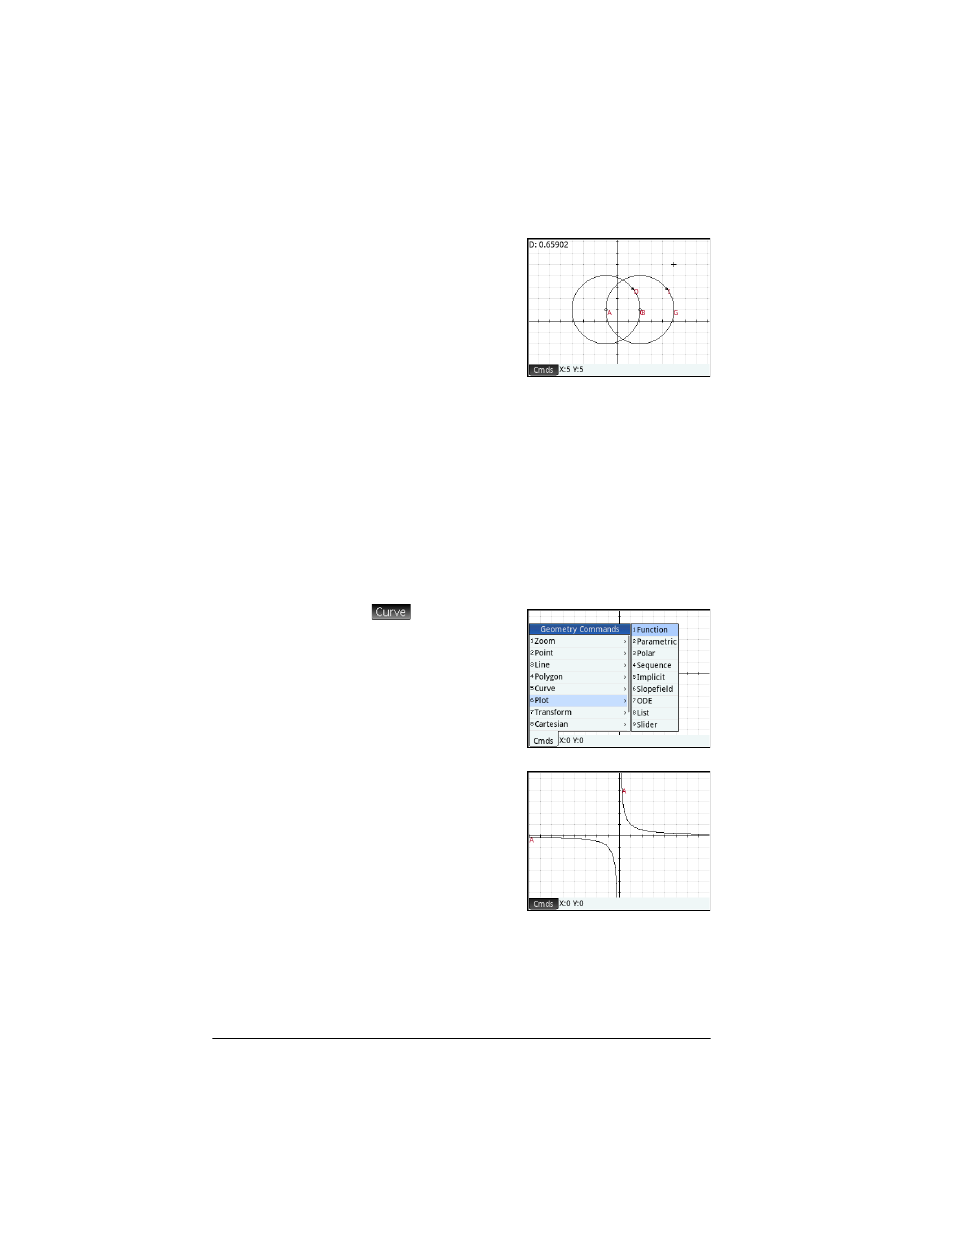
In the example at the right,
circle C has been drawn and
point D is a point placed on
C (using the Point On
function described above).
Point I is a translation of
point D. Choosing Curve >
Special > Locus places
locus( on the entry line. Complete the command as
locus(GI,GD) and point I traces a path (its locus) that
parallels point D as it moves around the circle to which it is
constrained.
Plot
You can plot expressions of the following types in Plot view:
•
Function
•
Parametric
•
Polar
•
Sequence
Tap ,
select
Plot
, and
then the type of expression
you want to plot. The entry
line is enabled for you to
define the expression.
Note that the variables you
specify for an expression
must be in lowercase.
In this example,
Function
has been selected as the plot
type and the graph of y = 1/
x is plotted.
Function
Syntax: plotfunc(Expr)
Draws the plot of a function, given an expression in the
independent variable x. An edit line appears. Enter your
expression and press E. Note the use of lowercase x.
- iPAQ Glisten (185 pages)
- iPAQ Glisten-AT&T (185 pages)
- iPAQ rx5900 Travel Companion (10 pages)
- iPAQ h1900 Pocket PC series (127 pages)
- iPAQ hx2700 Pocket PC series (168 pages)
- QuickSpecs H5400 (13 pages)
- 620LX (172 pages)
- IPAQ H1930 (13 pages)
- 700 Series (204 pages)
- iPAQ h5150 (8 pages)
- Jornada 420 (146 pages)
- iPAQ PC h1910 (2 pages)
- HX2000 (11 pages)
- iPAQ hx2000 Series (3 pages)
- h4000 (141 pages)
- iPAQ HX2495b (10 pages)
- 820e (178 pages)
- 820 (186 pages)
- iPAQ h1910 (105 pages)
- iPAQ hx2790c (10 pages)
- IPAQ Pocket PC hx2110 (7 pages)
- rx3000 Series (301 pages)
- iPAQ hx4700 (169 pages)
- 2490 (14 pages)
- iPAQ hw6500 (170 pages)
- h6300 (190 pages)
- IPAQ HX2750 (9 pages)
- iPAQ h2200 Pocket PC series (125 pages)
- iPAQ Pocket PC h5400 Series (10 pages)
- Jornada 520 (134 pages)
- iPAQ h4100 Pocket PC series (143 pages)
- IPAQ H5100 (169 pages)
- h5400 (273 pages)
- IPAQ RX3000 (60 pages)
- H2200 (9 pages)
- UNIX AA-XXXXX-TF (15 pages)
- Jornada 540 Series (135 pages)
- PC Series (22 pages)
- 430se (151 pages)
- h1937 EN (127 pages)
- PrintCalc 100 (33 pages)
- PrintCalc 100 (32 pages)
- 48gII Graphing Calculator (892 pages)
- 48gII Graphing Calculator (864 pages)
- EliteBook 2740p Tablet-PC (179 pages)