Display the test results – HP Prime Graphing Wireless Calculator User Manual
Page 77
Inference app
73
The table below describes the fields in this view for
the sample data.
The Numeric view is where you enter the sample statistics
and population parameters for the situation you are
examining. The sample data supplied here belong to the
case in which a student has generated 50 pseudo-random
numbers on his graphing calculator. If the algorithm is
working properly, the mean would be near 0.5 and the
population standard deviation is known to be
approximately 0.2887. The student is concerned that the
sample mean (0.461368) seems a bit low and it testing
the less than alternative hypothesis against the null
hypothesis.
Display the
test results
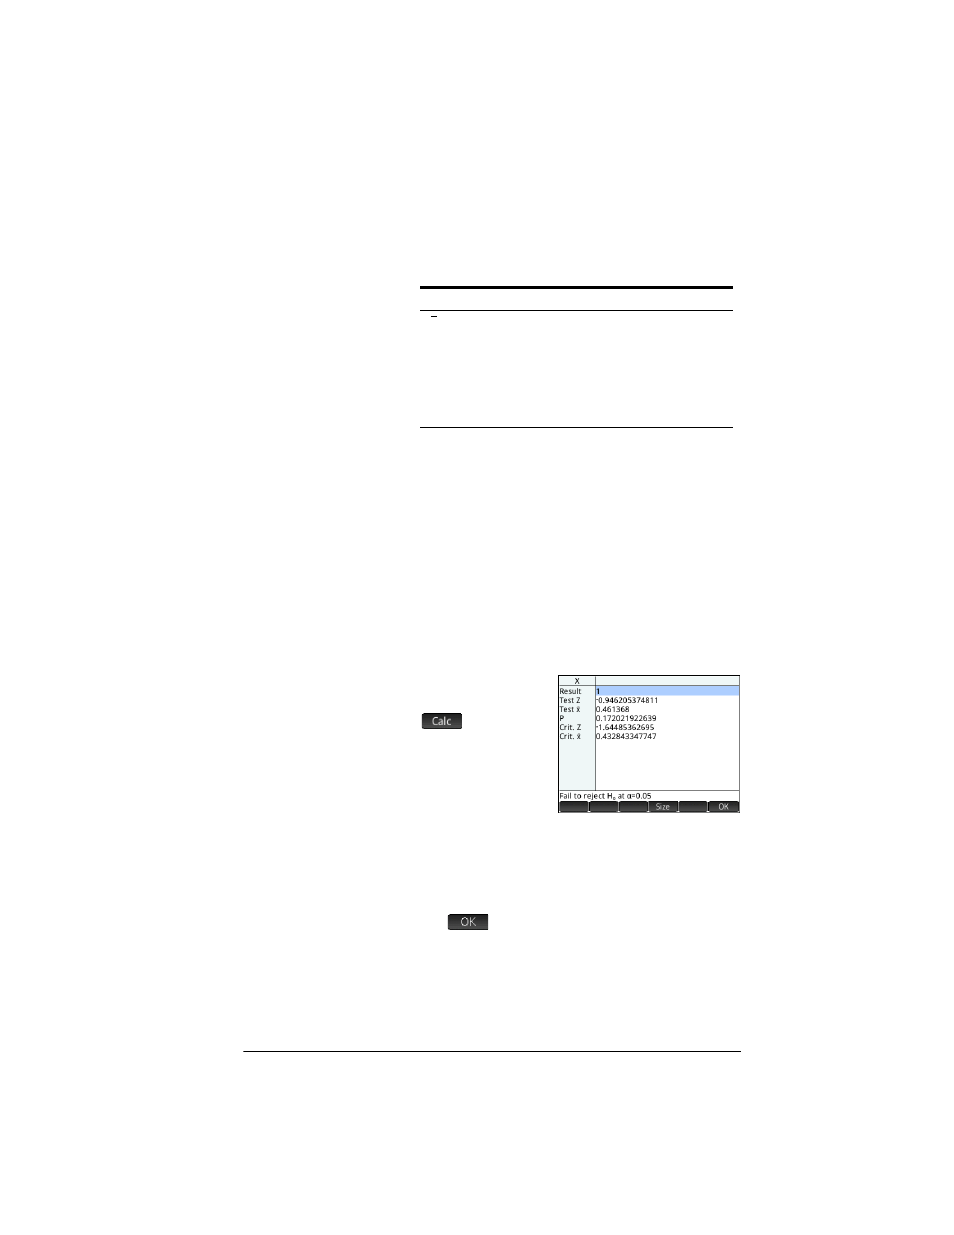
6. Display the test
results:
The test distribution
value and its
associated
probability are
displayed, along with the critical value(s) of the test
and the associated critical value(s) of the statistic. In
this case, the test indicates that one should not reject
the null hypothesis.
Tap
to return to Numeric view.
Field name
Definition
Sample mean
n
Sample size
Assumed population mean
σ
Population standard deviation
α
Alpha level for the test
x
μ
0