HP Prime Graphing Wireless Calculator User Manual
Page 10
6
Geometry
Preparation
1. Press
SK
.
2. On the first
CAS settings
page, set the number format to
Standard and the number of decimal places to 4.
Open the app
and plot the
graph
3. Press
I
and select
Geometry
.
If there are objects showing that you don’t need, press
SJ
and confirm your intention by tapping
.
The app opens in Plot view. This view displays a
Cartesian plane with a menu bar at the bottom. Next to
the menu bar, this view displays the coordinates of the
cursor. After you interact with the app, the bottom of the
display displays the currently active tool or command,
help for the current tool or command, and a list of all
objects recognized as being under the current pointer
location.
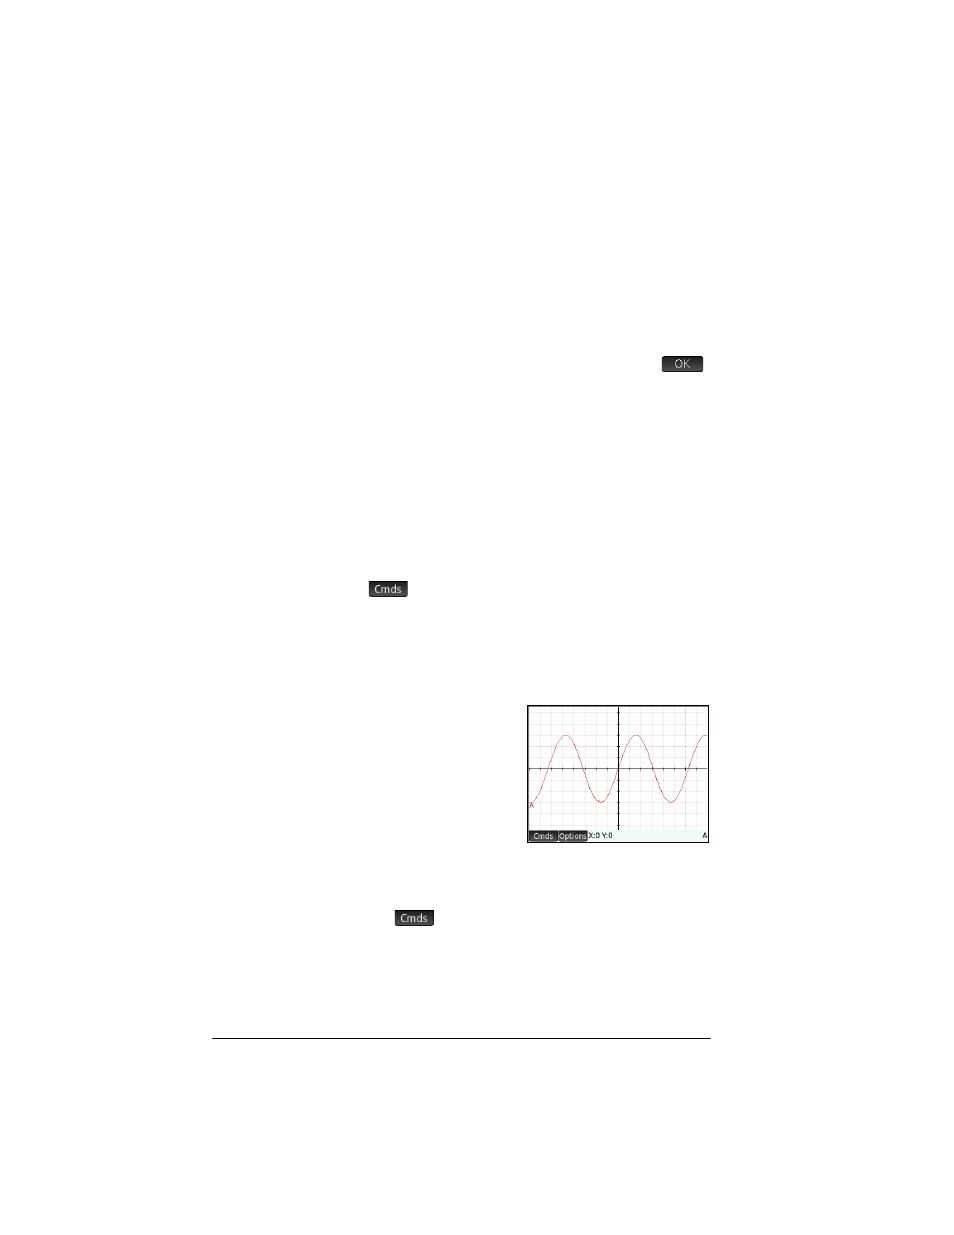
4. Select the type of graph you want to plot. In this example
we are plotting a simple sinusoidal function, so choose:
> Plot > Function
5. With plotfunc( on the entry line, enter 3*sin(x):
3
seASsE
Note that x must be entered in lowercase in the
Geometry app.
If your graph doesn’t
resemble the illustration
at the right, adjust the
X
Rng
and
Y
Rng
values
in Plot Setup view
(
SP
).
We’ll now add a point
to the curve, a point that
will be constrained always to follow the contour of the
curve.
Add a
constrained
point
6. Tap ,
tap
Point, and then select Point On.
Choosing Point On rather than Point means that the
point will be constrained to whatever it is placed on.