Overview of toolbar functions, Overview of toolbar function – HP Hub & Switch Management for OV-UX User Manual
Page 91
11-5
Management for Non-Browserable Devices
Overview of Toolbar Functions
M
a
nagemen
t for No
n-
B
ro
w
se
rabl
e D
e
vi
c
e
s
Overview of Toolbar Functions
HP Hub & Switch Management device functions in the Closeup Views allow
you to configure, monitor and manage HP hubs, bridges, and switches.
The following table summarizes the Toolbar menu functions in the Closeup
Views. For specific information about how to use a particular device function
or menu dialog box, click on the Help button in the dialog box.
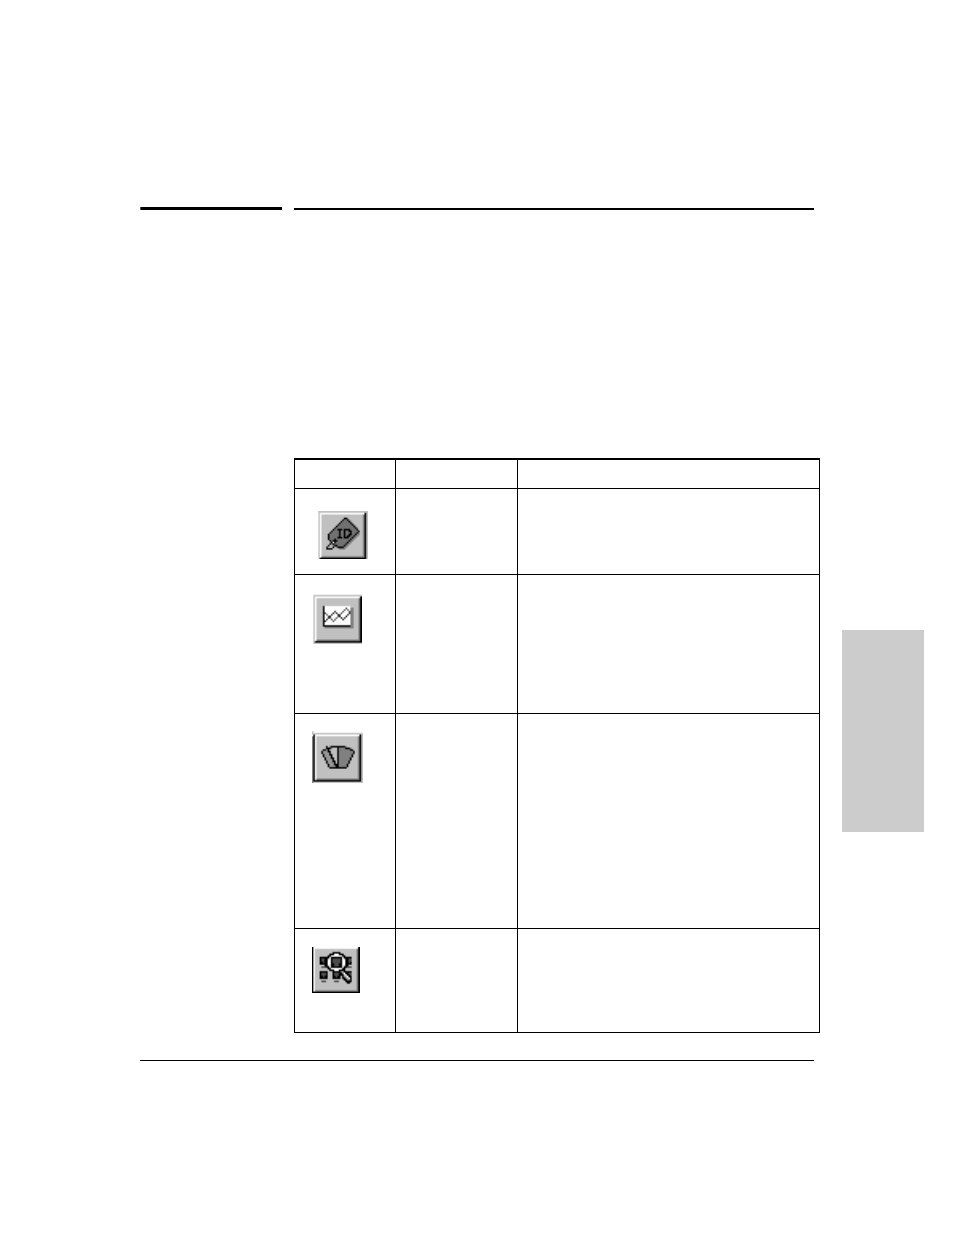
Table 11-1. Summary of Toolbar Functions
Icon
Toolbar Button
Description
Device ID
Displays identification information for an HP hub,
bridge or switch. For example, you can determine
the device type, firmware version, and MAC
address.
Graph Counters
Displays the Graph Counters - Graph window for
graphing various counters and statistical formulas
on a device. The default graph is the LAN Activity%
statistics. If you position the cursor over the
graphing area and press the right mouse button, a
pop-up menu is displayed. Select “Options” to
modify the counters and devices for graphing, and
to configure other graphing options.
Port Statistics
Displays gauges for viewing statistical counters for
a segment and selected ports on the segment.
• Hubs: gauges for LAN Activity, Error Packets,
and Broadcast Packets are displayed.
• Bridges: gauges for Broadcast Packets, Packets
Forwarded, Packets Filtered, and Error Packets
are displayed.
• Switches: gauges for LAN Activity, Packets
Forwarded, Packets Filtered, Broadcasts
Received, Collisions, and Errors Received are
displayed.
Port Statistics
Summary
Displays an information window that lists important
statistics and counter values for each port on the
device. The displayed counters will differ
depending on the device type (for example, 10Base-
T hub, 100VG hub, 10/100 switch, or bridge).